Tristan Muzzu
Blender add-ons for hard-surface modelling and game asset work.
I write tools for the parts of 3D work nobody enjoys. Panelling a hull by hand. Renaming two hundred objects. Checking scale for the fourth time because the last export came into Unity at 100x.
Everything here runs on Blender 3.6 through 5.2, and I check all seven installed builds before anything goes out. Add-ons that quietly break on a version bump are the fastest way to lose people.
PanelForge
Procedural sci-fi hull plating. Point it at a hard-surface mesh and it builds panel layouts, recessed sections, slatted vents, raised blocks and blade fins, spread across five material slots.
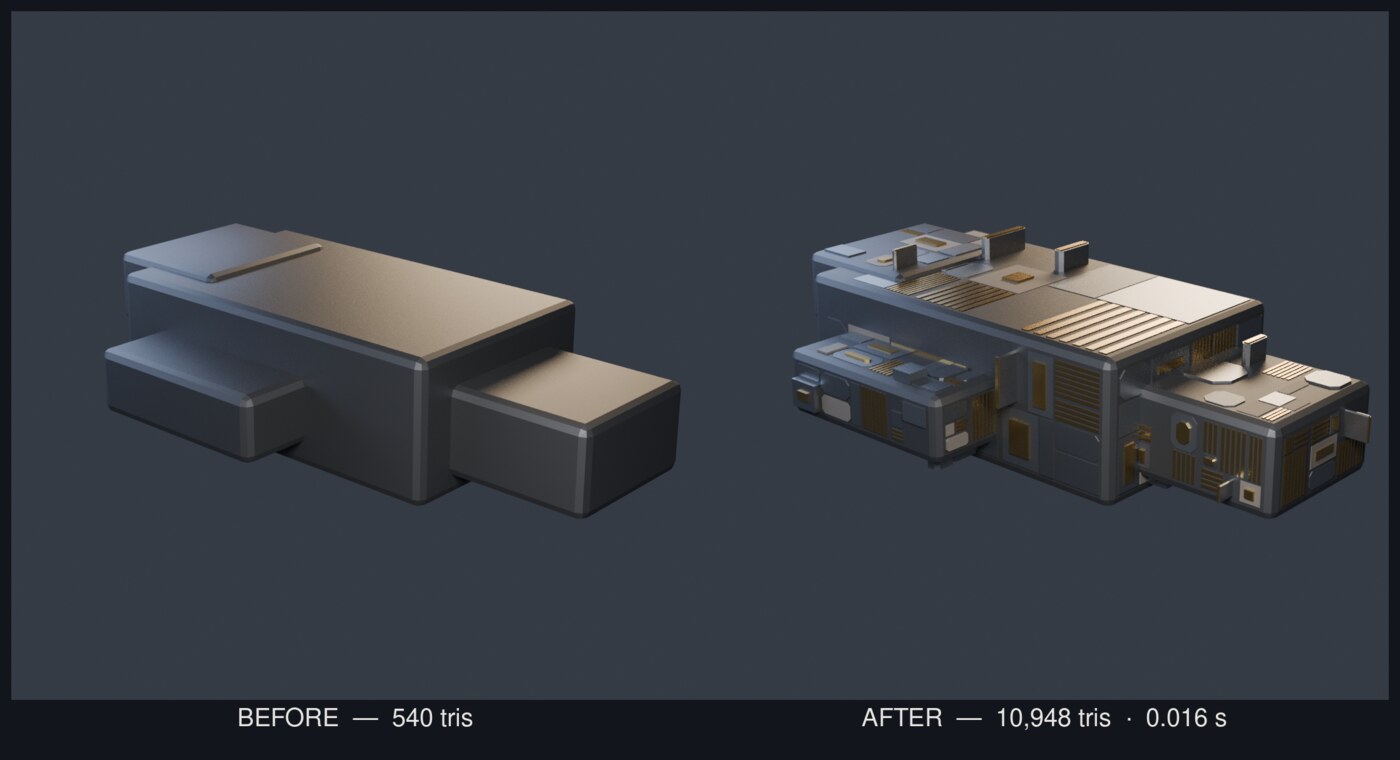
Most greeblers spray detail evenly and you can always tell. This one steps plate depths in fixed increments instead of drifting them, gathers detail into hotspots the way actual hardware does, and skips some plating so bare hull shows through. Sixteen parameters and a seed. Same seed, same result, every time.
Sci-Fi Corridor Kit
Six modular corridor pieces that tile on a 4 metre grid: a straight, a 90 degree corner, a T junction, a four way crossroads, a dead end, and a bulkhead doorway you walk through. They ship as .blend and .glb, and the Python script that generated them is in the zip.
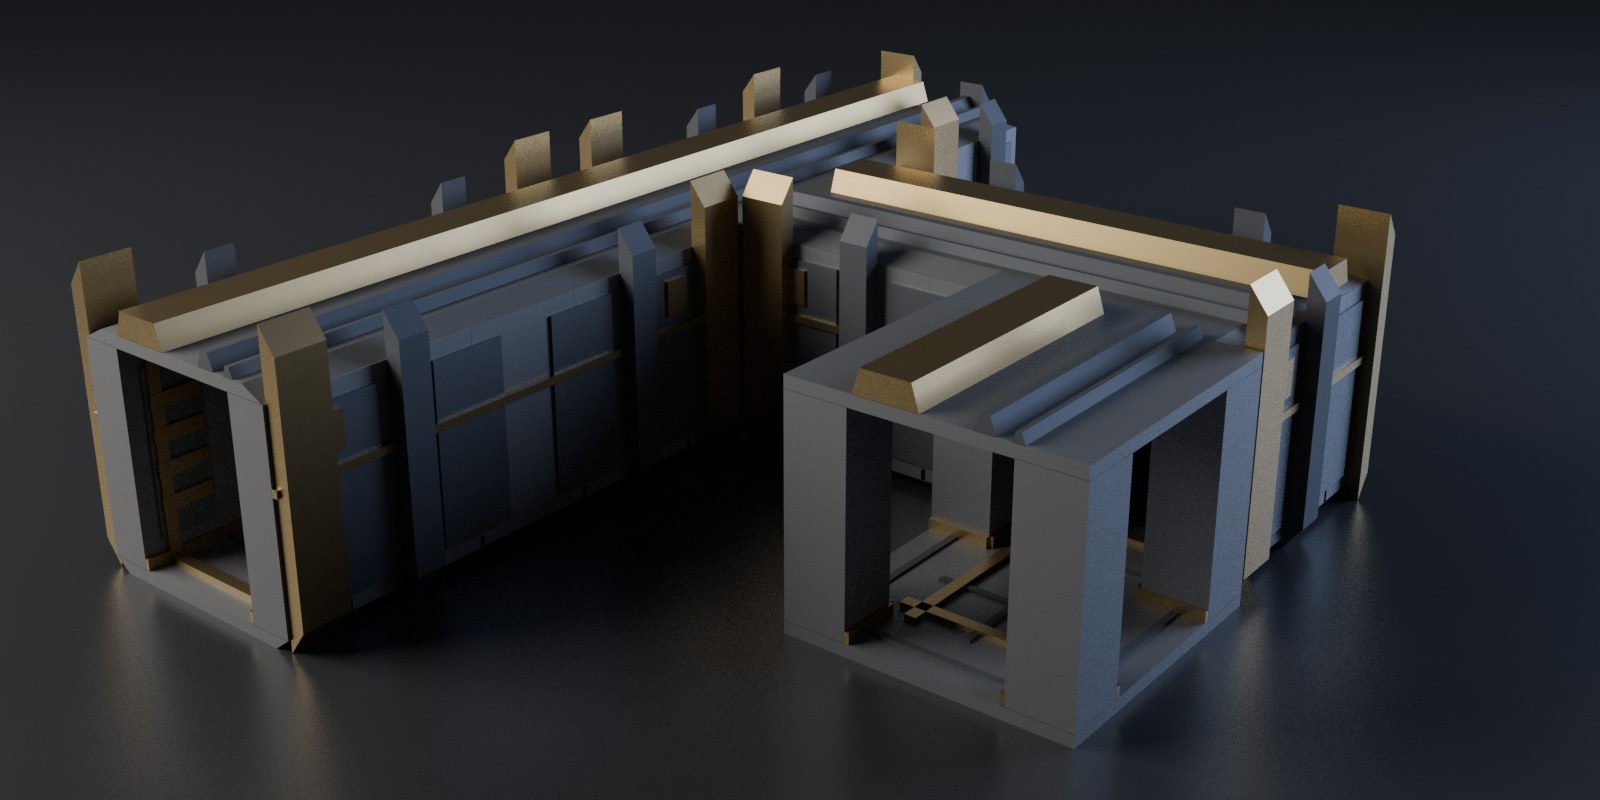
The zip carries a hard-gate report generated from the exact files you download, not from a rebuild: real-world scale, applied transforms, manifold geometry with no interior faces, UVs, triangle budget, and a glTF round trip that preserves the triangle count. Thirty six checks across six pieces. Every open edge also presents the same 8 point walk-through section, so the floor line, the ceiling line and the skirting run straight through a join instead of stepping.
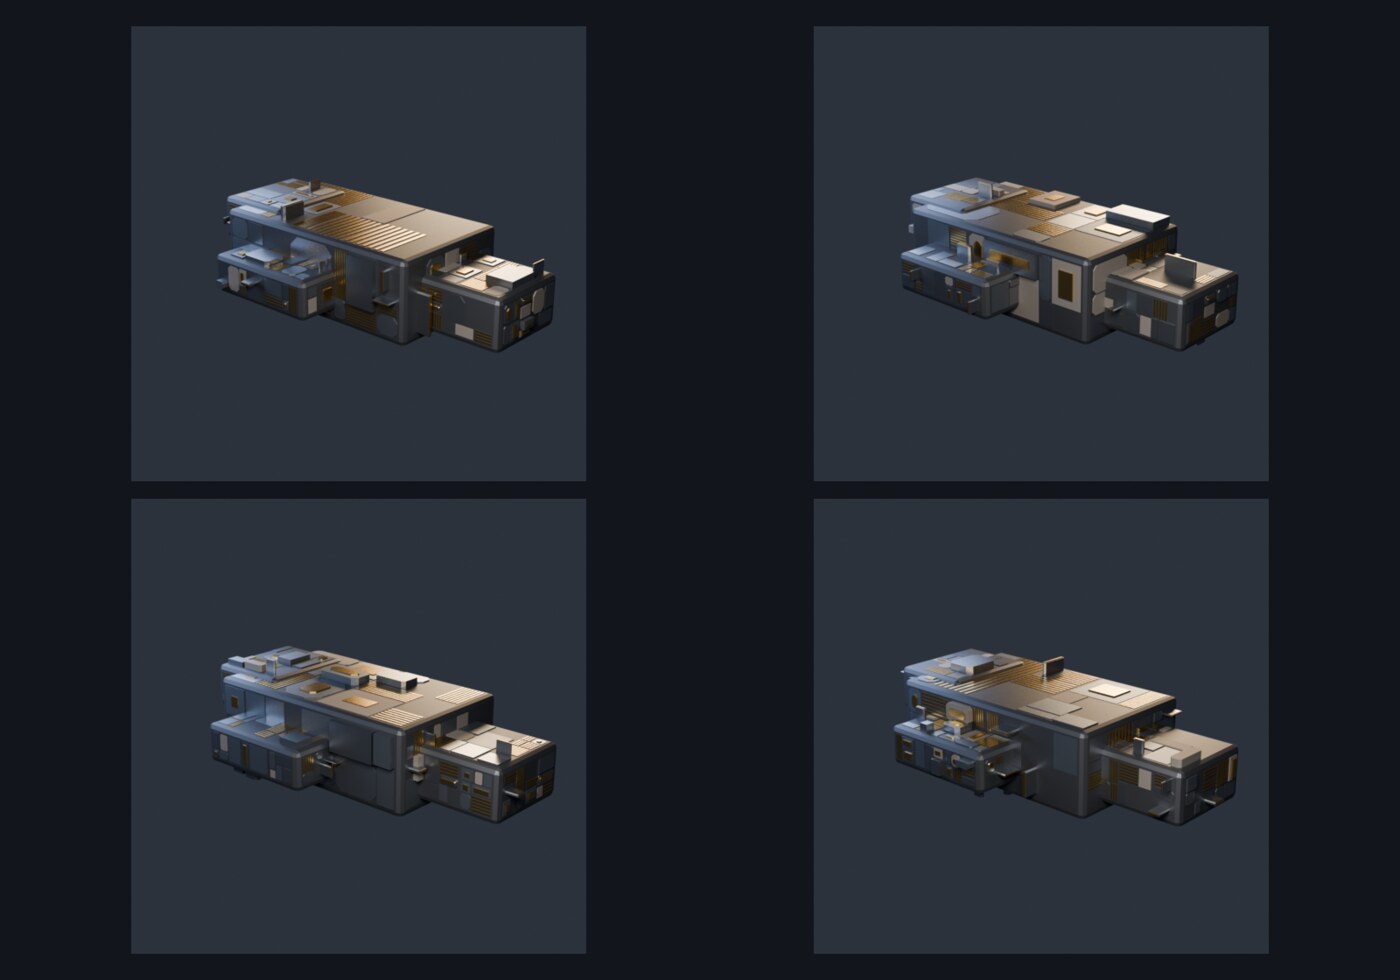
Change the seed and you get a different module: a different frame carrying the heavy arch ring, a different one missing, a vent on the other wall. Six seeds, six different meshes, and the same seed always gives the same one back. Nothing the seed touches goes near a seam.
WearForge
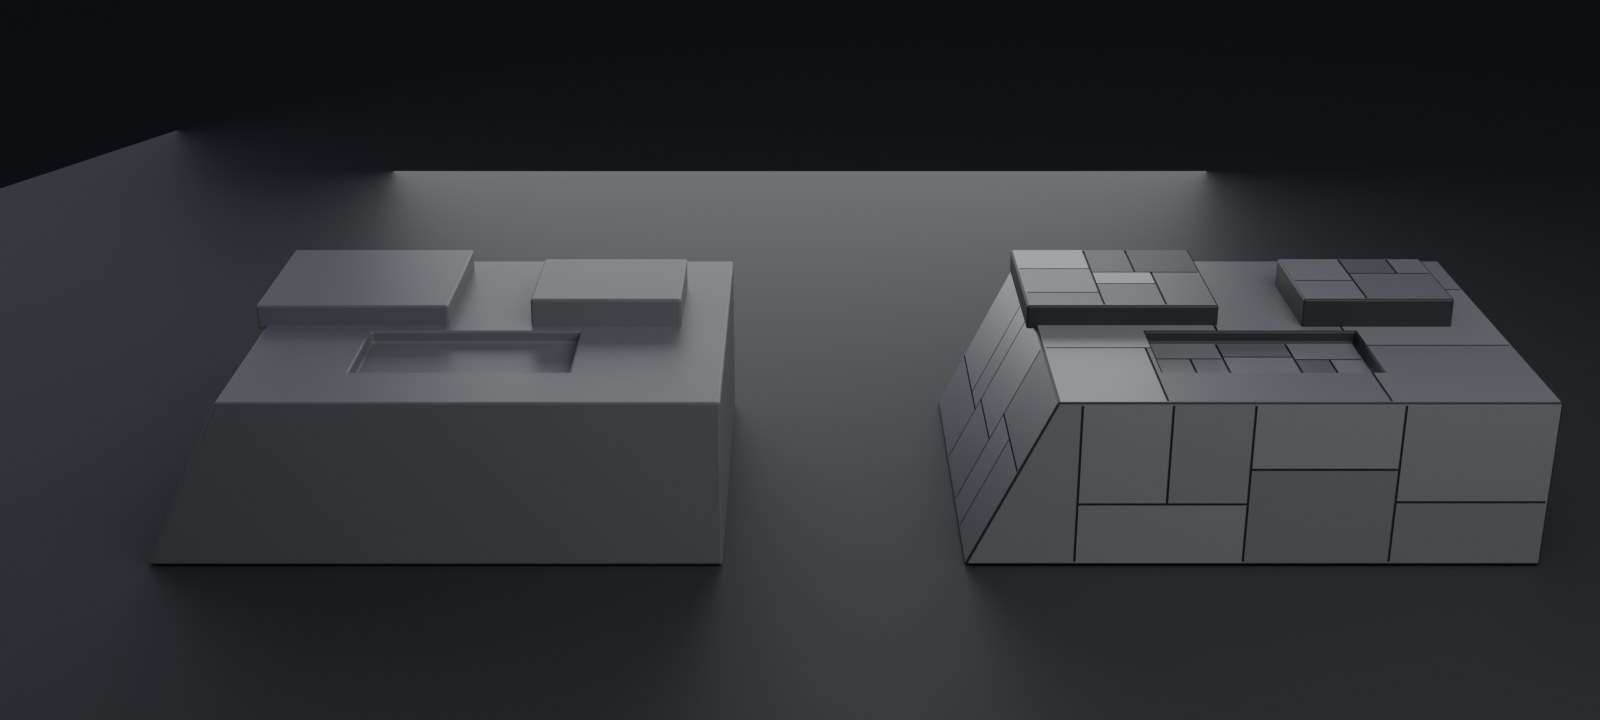
Worn edges on a model you already have. Select your objects, press one button, and every edge sharper than the angle you set gets a chamfer whose width changes along its length, with bites taken out of the parts that would actually take a knock. It is geometry rather than a shader, so it survives export and it does not care what renderer you use.
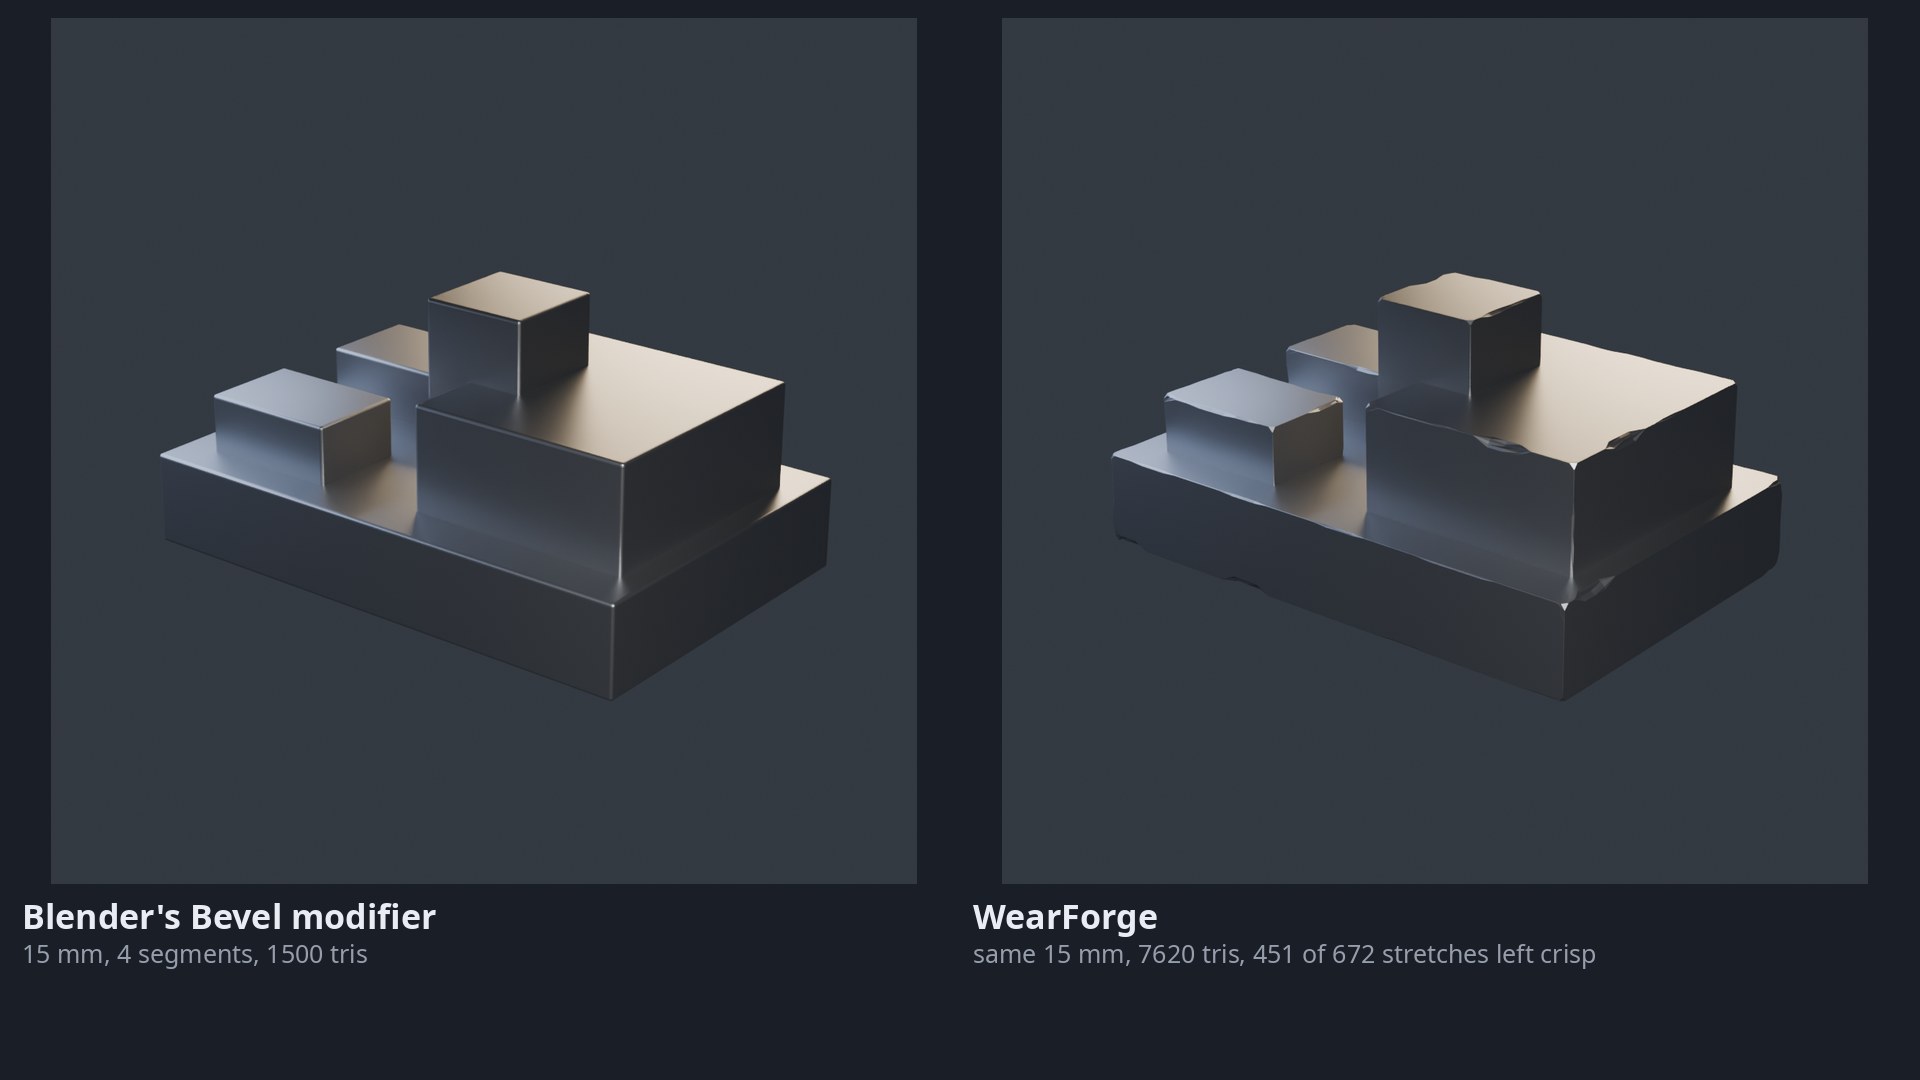
The comparison is against the Bevel modifier on purpose. Blender already ships one and it is free, so a picture of this next to nothing would be hiding the only question worth asking. Three things differ. The chamfer is not one width, and on that bracket it runs 1.8 mm to 36 mm. The wear is weighted toward edges that face up or outward, so a sheltered underside keeps its edge. And the damage clusters into regions instead of dusting evenly along everything.
The version before this one bowed flat faces by up to 28.7 mm and no count could see it: verts, triangles, non-manifold edges and the position digest were all normal, and the render was the thing that showed it. Every run now reports the worst distance any vertex sits off its own face's plane, and the test suite plants a 4 mm bow and requires the same measurement to find it.
Being straight about the limit: it changes a close shot and it does not change a thumbnail. Shrink that comparison to 150 pixels and the two halves are hard to tell apart.
LineForge
Panel seams cut into a model you already have. It finds the flat areas,
divides each one into panels, and sinks a real groove along every seam. No
decals and no normal map, so it survives export and it reads in the
silhouette up close. Every face comes back carrying a panel
attribute, one value per panel and 0.0 on the seams, so you can tint or
roughen panels separately without selecting anything by hand.
panel attribute driving base colour and roughness, nothing
hand-assigned.The thing that took longest was not the cutting. A groove that ran to the edge of its flat area left its end wall lying in the neighbouring area's plane, back to back with a surface already there: 15 zero-thickness flaps on one test slab, manifold, real area, and invisible to every count I had. The render missed them too. What found them was asking the slab whether any face on its bottom plane pointed upwards, and that question is now in the test suite with a planted case that produces 62 of them.
Being straight about the limits, both of which are on the store page too. A groove still stops inside its own flat area rather than running round a corner as one cut, so up close a corner is two grooves that agree rather than one that carries through. And a plate that merely sits on a surface shares no edge with it, so there is nothing there for the follow-the-model pass to find: recesses and boolean cuts it can see.
PanelForge 1.0.0
New media for the product page. It's rendered headless at 1080px, 64 samples, EEVEE, seed 3, so any of it rebuilds exactly.
The sweep runs the slider up and then back down, so what you're watching is one object changing rather than a row of separate renders.
What broke between Blender 3.6 and 5.2
The add-ons on this page get run on five Blenders, and doing that turns up things a single-version check never shows you. Every one of the three below had me hunting through my own code first. I measured all of it again this afternoon on 3.6.23, 4.2.23, 4.5.12, 5.0.1 and 5.2.0, so the figures below are from today rather than from my notes.
FBX export is dead on the 5.0.1 build my package manager ships. Any call to bpy.ops.export_scene.fbx raises AttributeError: 'ExportFBX' object has no attribute 'use_space_transform', thrown from line 606 of the bundled io_scene_fbx. Here's the part that took me ages to see. That operator declares 5 properties on 5.0.1, against 42 on 3.6.23 and 43 on the other three. It registers almost nothing, and then the exporter's own execute() reads an option its own operator never created. The identical export writes between 26,428 and 26,764 bytes on 3.6.23, 4.2.23, 4.5.12 and 5.2.0, from the factory startup scene, no complaints. So if your export script died and you're on a distro Blender, print len(bpy.ops.export_scene.fbx.get_rna_type().properties) before you go hunting through your own code. What I can't tell you is whether upstream 5.0 has this. I only know this packaged 5.0.1 does and that blender.org's 5.2.0 doesn't.
Action.fcurves stops existing, and later than I had it written down. My own note said 4.4. That was wrong: 4.5.12 still hands back three F-curves quite happily, and the attribute is gone on both 5.0.1 and 5.2.0. The new layers attribute turns up at 4.5.12, so 4.5 is the one version where both APIs answer and either style of code runs. Anything that walks action.fcurves to set interpolation throws on 5.x. The turntable add-on here got fixed by leaving the Action API alone altogether: set preferences.edit.keyframe_new_interpolation_type before inserting the keys, then put it back. That runs unchanged on all five. Corrected on 25 August: it runs, and it does not work. That preference never reaches keyframe_insert(). I measured it on 3.6.23, 4.2.23 and 5.2.1: the preference reads LINEAR and the keys come out BEZIER on all three, so every turntable the add-on built eased in and out for its whole life. Frame 2 of a 48 frame turn sat at 0.0084 radians where linear is 0.1337, and both ends matched perfectly, which is why nothing I checked could see it. What actually works is to insert the keys and then set interpolation on the keyframe points themselves, reaching them through action.fcurves on 3.6 to 4.5 and through layers, strips and channelbags on 5.x. The add-on does that now and the sampled frames match linear to six decimal places.
Last one is small and it bit me anyway. bpy.app.version_string is not something you can parse. 3.6.23 returns "3.6.23" while 4.2.23 returns "4.2.23 LTS", so the suffix is on some builds and not others, and a script of mine ran int() over that last field and died. bpy.app.version gives you a tuple of integers. Use that instead.
None of this is exotic. It's what falls out of running the same script on every version you claim to support, which takes six seconds on this machine for twelve add-ons across the five versions installed when I measured it, and is the only reason I know any of it. PanelForge, the paid one, goes through the same five.
Sixteen sliders, and what each one actually does
I spent this morning writing the manual for PanelForge and it went badly, in the useful way. You cannot describe a setting you have not measured, and it turns out I had shipped one that does far less than its slider suggests.
Start with the honest part. Structural Bays is a whole number from 1 to 12 in the panel. It has three behaviours. The core computes the subdivision depth as int(log2(n)), so 1, 2 and 3 all mean one split, 4 through 7 all mean two, and 8 through 12 all mean three. On a 1.55 by 0.92 by 0.55 metre box at seed 3, that's 72 plates, then 130, then 225, and no other outcome exists. Nine of the twelve positions do nothing at all. Nobody had caught it because nobody had swept the range and written down what came back, and a tooltip saying "large forms read before small detail" is true whichever step you land on. It's getting fixed in the next release, as a real subdivision count, and that will move everybody's seeds, which is why it needs a version number rather than a quiet patch.
The rest of the sweep was more cheerful, and the numbers are worth having if you build generators of your own. Everything below is the same 270 face blockout, seed 3, one parameter moved at a time, measured on Blender 5.2 this morning.
Subdivisions is the size dial for the entire result. At 1 you get 81 plates and 3,664 triangles, at the default 3 you get 262 and 11,388, at 6 you get 597 and 23,012. Nothing else in the panel has that kind of range, so it's the first thing to move if the density is wrong rather than the arrangement.
Min Panel is the one that quietly decides whether anything happens at all. It's the smallest plate edge allowed, in metres, and plate cutting stops when the next cut would go under it. At 0.05 you get 319 plates, at 0.10 you get 262, at 0.40 you get 39. Push it past the size of your largest face and you get nothing, which is the single most common way a tool like this appears broken when it's working exactly as told. That's why the operator reports the number it needs rather than failing silently.
Detail chances interact more than you'd guess, because they compete for the same candidate plates. Vents at 0.0 gives 339 plain plates and no vents. At the default 0.20 you get 74 vents. At 1.0 you get 314 vents, 30 plates and something that looks like a radiator. Fins are the only detail that break the silhouette, so they're the ones to be careful with: 0.06 gives 28 fins, and 0.5 gives 193 and buries the shape underneath them.
Depth Scale surprised me by being completely safe. It multiplies how far plates stand off the surface and touches nothing else, so 0.15, 1.0 and 2.4 all produce the same 262 plates and the same 11,388 triangles at three different reliefs. Once you have a layout you like, that's the slider you can play with without losing it.
Two things I'd take away from this if I were writing my own greebler. First, any parameter you pass through a rounding function needs its real steps exposed in the interface, or your slider is lying and you won't find out until somebody documents it. Second, detail sprayed evenly is what makes procedural work look procedural, so leave some of it off on purpose. The default here skips 7% of plates, and the bare hull showing through does more for the result than any of the detail settings do.
The manual with all of this in it ships inside the zip and lives on the product page. If you want the add-on that produced the numbers, it's here.
Changing a generator without moving everybody's meshes
Yesterday I wrote up a slider in my own add-on that turned out to have three settings wearing twelve labels. Structural Bays runs 1 to 12, the core fed it through int(log2(n)) to get a recursion depth, and so 1, 2 and 3 all did the same thing, 4 through 7 all did the same thing, and 8 through 12 all did the same thing. Nine of the twelve positions were decoration. Today I fixed it. The fix took about twenty minutes and the part that took the rest of the afternoon was proving I hadn't moved anybody's existing output, which is the bit worth writing down.
Here's the problem with touching a procedural generator once it's out. People have files. If the same seed and the same settings stop producing the same mesh, the first anyone hears about it is that the ship they parked last month has quietly become a different ship. Blender won't warn them. There's no diff to read. So any change to the guts of one of these needs an answer to "what moved", and the answer has to be a measurement rather than a feeling.
Three things made that answerable, and none of them are specific to my add-on.
The first is to hash the vertices rather than count them. I ran the whole 1 to 12 sweep before the change and after it, and for each run I recorded the stats dictionary plus a SHA-256 over every vertex coordinate at six decimal places, truncated to sixteen characters so it fits in a table. That last bit matters more than it sounds. Before the change, settings 1, 2 and 3 all reported 262 plates and 11,388 triangles, which on its own only tells you three runs landed on the same counts. Counts collide. The hash 2fb72b58e395fee9 appearing three times tells you they're the same mesh, vertex for vertex, and that's the claim I actually wanted to make. I've been burned by counts on this project before: an early version of this generator passed every numeric gate I had and rendered as spikes shooting into space.
The second is to leave the random number generator alone until you know you're going to use it. The old splitting function checked its rectangle for size, then drew a random split position, then checked whether the split was legal. When it wasn't legal it returned the rectangle unsplit, having already consumed a number from the stream. Every seed is a stream, and one extra draw shifts everything downstream of it. My rewrite pulls the "is this rectangle even big enough" test in front of the draw, so a rectangle that can't divide costs nothing and the sequence stays where it was. If you're refactoring anything seeded, that ordering is the thing to check first. It's invisible in a diff review and it changes every result.
The third is the one I'm pleased with. The old default was 3, which log2 collapsed to one split. The new code splits to a literal count, so a default of 2 performs exactly one split, same rectangle, same single draw from the same stream. Pick the new default to land on the old code path and the default mesh doesn't move at all. I checked rather than assumed: hash 2fb72b58e395fee9 before and after, 262 plates, 74 vents, 28 fins, 18 risers, 50 greebles, 11,388 triangles, 7,120 vertices, 5,106 faces, all identical. Everything I've published, the store images and the demo clip and the figures in the manual, was made at defaults, so none of it needed regenerating. That was luck as much as planning. If my images had used a hand-set value I'd have spent this evening re-rendering. What I can't do is protect a file where somebody set the thing to 7 by hand, because 7 used to be an alias for one of the three steps and now it isn't, so that mesh does move and the changelog says so in as many words.
What the setting does now, measured on a 1.55 by 0.92 by 0.55 metre box at seed 3: settings 1 through 12 give 6, 12, 18, 24, 30, 36, 42, 48, 54, 60, 64 and 66 bays. Six faces, so it's six times the setting until the faces run out of room somewhere past 10 and it caps. Plate counts go 38, 69, 96, 120, 164, 181, 205, 222, 228, 234, 248, 260. On the five-part hull I use for the listing renders, all twelve settings produce twelve distinct vertex hashes, where before there were three.
Then a regression test, and I made it fail before I trusted it. This project has been wrong six times about a green check that had no way to go red, mostly because Blender exits 0 even when a --python script dies with an unhandled exception. So the new case sweeps bays 1 through 8 and asserts every step increases, and before committing I put the log2 line back and watched it print "flat steps in [12, 12, 12, 18, 18, 18, 18, 24]" and drop the suite to 17 of 18. Then I put it back. A check you've only ever seen pass is a check you're guessing about.
The suite is 18 edge cases now, run on 3.6.23, 4.2.23, 4.5.12, 5.0.1 and 5.2.0, which is 90 runs. All green. The one thing I can't tell you is whether anyone would have noticed the original bug on their own, because nobody has bought this yet.
Two numbers for the same thing, and neither of them was right
This morning I was about to publish a video description that said my add-on plates a hull in about 22 milliseconds. The product page for the same add-on, describing the same operation on the same mesh, said 0.016 seconds. Both numbers had an evidence row behind them in the repo. Both said "measured". They disagree by a factor of two, and I had been looking straight past that for five days.
So I stopped and measured it properly, and the interesting part is not the answer. It's that neither published number was the answer.
Here is what the measurement actually looks like. Time the function, not the operator, because the operator wrapper drags in depsgraph work that has nothing to do with the thing you are claiming:
import time
from panelforge.core import PanelParams, panelize

times = []
for i in range(25):
    bpy.ops.wm.read_factory_settings(use_empty=True)
    obj = build_hull()
    t0 = time.perf_counter()
    panelize(obj.data, PanelParams(seed=3))
    times.append(time.perf_counter() - t0)
times.sort()
print(times[len(times) // 2] * 1000)
Rebuilding the scene inside the loop matters. If you build once and generate twenty-five times you are measuring the second run onwards against a mesh that already has plating on it, which is a different job.
The result, on the 270 face hull the product images were made from, at seed 3:
Blender 5.2.0, three separate runs of that script: median 29.61 ms, then 29.99, then 23.95. Blender 4.2.23: median 22.10 ms. The fastest single sample across all of it was 22.09 ms, and the slowest was 46.49.
So 22 milliseconds is the floor. Not the typical case, the floor. And 16 milliseconds is below every single hull sample I have ever taken on this machine.
Where did 16 come from, then? Almost certainly a cube. A plain 2m cube through the same function is 6.56 ms on 5.2.0 and 4.76 ms on 4.2.23, and somewhere in the first week I timed one and wrote the number into a sentence describing an 11,388 triangle ship module. The evidence row I wrote at the time recorded the figure, the sample count and the Blender version. It did not record what I ran it on. That omission is the whole bug.
Four things I would now do differently, and three of them are about writing the claim rather than taking the measurement.
Name the input in the same breath as the number. On its own, "0.016 s" decorates a sentence without committing to anything. "0.016 s on a 6 face cube" commits, and you can see at a glance that it does not support a sentence about a ship module.
Take the range, not the median. My three runs on one version and one machine spread 24 to 30 ms, which is about 25% of the value, and all that changed between them was what else the laptop was doing. A single median presented as the number implies a precision that is not there. Two of my three runs would have made a liar out of the third.
Watch the direction of the rounding. This is the one I got properly wrong. I had a note in the repo saying the copy "rounds up, which is the safe direction", and for a duration that is true: saying something takes longer than it does can only disappoint someone upward. But I was not rounding a duration, I was quoting a speed, and rounding a speed up is the unsafe direction. Same number, opposite sign, and the note had been sitting there being reassuring about it since launch.
Compare your claims against each other as well as against reality. The check that found this was not a test and could not have been. It was two sentences I had written, on two different surfaces, sitting next to each other for the first time. Nothing in a test suite can tell you that the manual and the store page disagree, because both are outside it.
What I cannot tell you is which mesh the original 14.3 ms reading came from, because I did not write it down and the run is gone. The cube is the best guess and it fits, but it is a guess, and the honest version of this post says so rather than presenting the reconstruction as a finding.
The manual now says 22 to 30 milliseconds and explains the spread. The store page says the same. The FAQ entry that used to quote the fast number now says where that number probably came from. All of that is worse copy in the marketing sense and better copy in every sense that matters, and it took about forty minutes, most of which was measuring rather than writing.
Five fins read as a radiator. Two read as a corridor.
I spent three versions of a modular corridor kit failing the same rubric row, and the fix in the end was deleting three quarters of the geometry I had just added. Here's the measurement, because the lesson isn't obvious and I didn't see it until I rendered the thing at the size a store actually shows it.
The row that would not move
I score every asset against five criteria before it ships, 1 to 5 each, and one of them is silhouette: is this readable as a black shape at thumbnail size? My corridor module scored 2 on that row in v1 and 2 again in v2. Everything else went up. v1 was 8 out of 25, v2 was 15, and the silhouette row sat there, because the outside of the module was a bare rectangular trough with a constant profile along its length. Inside, it looked like a corridor. Outside, it was a bar.
So v3 was supposed to fix exactly that. I chamfered the roof, chamfered the base, pulled the floor and ceiling slabs in by 25cm so they weren't the widest thing any more, and put an exterior fin at every one of the five structural frames, standing full height, reaching past the slabs to the module edge, with the tops rising 22cm above the roof so the top edge would have a rhythm.
Six of six hard gates. 540 triangles. Every version of Blender from 3.6 to 5.2. Seam gap of 0.0 across a four-module run, measured off world-space vertex extents rather than assumed from the 4m spacing.
It scored 17 out of 25 and it looked like a heat exchanger.
Rendering the actual question
Here's the part I'd been getting wrong for two versions. The silhouette row asks about a black shape at thumbnail size, and I had been scoring it by looking at a lit three-quarter render at 1400x900 and imagining. That's a different question, and imagining is where the answer comes from if you don't render it.
So I added a shot to the rig that asks the question literally. Every material replaced with black emission, world set to white, output at 240x200:
flat = bpy.data.materials.new("SIL")
flat.use_nodes = True
nt = flat.node_tree
for n in list(nt.nodes):
    if n.type != "OUTPUT_MATERIAL":
        nt.nodes.remove(n)
emit = nt.nodes.new("ShaderNodeEmission")
emit.inputs[0].default_value = (0, 0, 0, 1)
nt.links.new(emit.outputs[0], nt.nodes["Material Output"].inputs[0])
for o in objs:
    o.data.materials.clear()
    o.data.materials.append(flat)
It costs 3.5 to 4.0 seconds in EEVEE, three runs, and that's the whole process: Blender starting up, building the mesh and rendering. At 240px, v3's five fins per module were a comb: five teeth at an 80cm pitch, and the gaps between them closed up completely under the downsample. The fins were there. The information they carried was not.
The number was the count
Both rows still under 4 had one cause between them, and it wasn't the shape of the fins or their depth or their taper. It was how many there were.
Five plates evenly spaced along a three-metre flank is a heat sink. That's what a row of evenly spaced plates over a surface is, and calling them structural ribs in the code doesn't change what a person sees. It's also textbook uniform randomness, bolts every 10cm at identical spacing, arriving as the largest feature on the piece, in the same version where I'd carefully removed that pattern from everywhere else.
I went to two per module. Always including the heavy arch frame, and the second one chosen with a minimum spacing of two frame slots, cyclic, so that two modules tiled together never end up with a pair 80cm apart across the seam. The survivors are nearly twice as wide, since they're carrying the visual load the five used to share, and the arch's fin rises 78cm above the roof against 46cm for the other, so a tiled run has one tall accent and one short one per module instead of five identical teeth.
Silhouette went 3 to 4. Detail placement went 3 to 4, because the same five plates that read as sprayed now read as placed, and with three of them gone the flank plating and the shoulder rail underneath are actually visible. 17 out of 25 to 19.
The triangle count went down.
The check I wrote caught my own first attempt
The spacing rule needed to be cyclic and I didn't write it that way first. My first version picked any frame that wasn't the arch and wasn't the missing one, and seed 1 immediately produced fins on slots 0 and 1, which are adjacent: 80cm apart, which is the exact v3 spacing with three of the five deleted.
The assertion I'd written ten minutes earlier caught it on the first seed I tried:
step = kit.MODULE / kit.RIBS
for s in range(1, 60):
    f = kit.plan(s)["fins"]
    gap = (f[1] - f[0]) * step
    wrap = (kit.RIBS - f[1] + f[0]) * step
    assert min(gap, wrap) >= step * 2, \
        f"seed {s}: fins {f} are {min(gap, wrap):.2f}m apart"
The wrap term is the one that matters and it's the one I'd have left out. Slot 4 and slot 0 are neighbours once you put two modules end to end, so the distance is cyclic, and a rule that only measures f[1] - f[0] passes a pair that looks fine alone and doubles up at every seam.
A hole in a wall is still manifold
One more, from the same week, and it's the sharper lesson.
I generalised the module so a corner, a T junction and a dead end all come out of one code path, the only difference being which edges the corridor opens on. The first version built one wall band per closed side and nothing per open side, reasoning that the perpendicular bands would cover the corners.
True for a straight, where both perpendicular sides are closed. False for a corner. The region from x 1.1 to 1.75, y -2.0 to -1.1 belonged to no band at all, so the corner shipped with no wall on the flank it doesn't open by. A hole in the corridor at the one place the corridor isn't turning.
All six hard gates passed it. Scale passed, transforms passed, manifold passed, UVs passed, triangle budget passed, and the glTF round trip passed. Of course they did. A hole in a wall is still manifold, still the right size, still has UVs and still round trips.
I found it by rendering a contact sheet and looking at it.
Then a second one, one layer down: the skirting stopped dead at the module edge on a corner, because trim was emitted per closed side and an open side still has a stub of wall at each end of its opening. Six of six gates again. Trim that ends early is still manifold too. That one was caught by a check I'd added the same morning, which compares the corridor cross-section each piece presents at a shared edge, and it named it precisely: 2 points present on the straight and absent on the corner.
What I'd take from it
Render the question you're actually asking. If the criterion is about a thumbnail, render a thumbnail. Four seconds of EEVEE told me something that two versions of staring at a beauty render had not.
And a full set of green gates tells you the mesh is well formed. It tells you nothing whatsoever about whether the thing is right. I've now had that lesson four times on this project, most memorably from an asset that passed 456 panels, 0 non-manifold edges and 25,120 triangles while rendering as spikes shooting into space.
Your .blend does not open in the version your store page claims
I nearly shipped an asset pack whose product page said "Blender 3.6 and up" and whose files Blender 3.6 refuses to read. Not "opens with warnings". Refuses:
Error: Failed to read blend file '.../kit_corner.blend', not a blend fileThe files were fine. The claim was fine on its own terms. The thing joining them was wrong, and I'd built a five-version test matrix that could not see it.
Two claims that sound like one
.blend is forward compatible and not backward compatible. A file saved by 3.6 opens in 5.2. A file saved by 5.0 does not open in 3.6, and the failure isn't soft. You don't get a mesh with missing materials, you get a refusal to parse.
Here's the trap. I have a script that runs any Python file through every Blender I've got installed, 3.6.23, 4.2.23, 4.5.12, 5.0.1 and 5.2.0, and reads the traceback out of stdout because Blender exits 0 even when a --python script dies. It's a good rig. It had been green for weeks.
What it proves is that the generator runs on five versions.
What the store page says is that the files work on five versions.
Those are different sentences, and I'd been reading the first one as evidence for the second for about a week. The generator ran on 3.6 quite happily. Nobody ever asked 3.6 to open the output, because the output was written by whichever Blender happened to be on PATH, which is 5.0.1 here.
What it costs
For a pack, the whole cost. A buyer on 3.6 downloads the zip, double-clicks a file, gets "not a blend file", and reasonably concludes the product is broken. They can't tell the difference between an incompatible save and a corrupt upload. That's a refund and a one-star review, and the listing told them it would work.
For a free tool it's just as bad and slower to find out about, because the person who hits it usually assumes they've done something wrong.
The fix is one line, and the check is the real work
Export from the oldest version you claim. That's it:
OLD_BLENDER="$(ls -d "$HOME"/blender-versions/blender-3.6*/blender | head -1)"
"$OLD_BLENDER" -b --python export.py -- --piece corner --dir "$STAGE"
Save compressed while you're there. My corner piece is 495,440 bytes as an uncompressed 3.6 save. With compress=True it's 97,543, which is smaller than the 100,003 that 5.0 was giving me.
The check matters more than the fix, because the fix silently rots the moment somebody runs the build on a machine where that path doesn't exist. So the test opens the files in the zip, in every installed Blender, and looks at what comes back rather than at the exit code:
def probe(binary, blend, script):
    r = subprocess.run([str(binary), "-b", str(blend), "--python", str(script)],
                       capture_output=True, text=True, timeout=600, check=False)
    for line in r.stdout.splitlines():
        if line.startswith("PROBEOK ") or line.startswith("PROBEFAIL"):
            return line
    if "not a blend file" in r.stdout or "not a blend file" in r.stderr:
        return "PROBEFAIL not a blend file"
    return "PROBEFAIL no verdict on stdout"
Three things in there are deliberate.
It reads a verdict out of stdout instead of trusting the return code, because a Blender whose Python died still exits 0. It has an explicit branch for "no verdict at all", so a probe that never ran is a failure rather than a silent pass. And it points at the staged zip directory, not at a fresh export, because a test that rebuilds what it's testing is only testing the rebuild.
The probe itself prints the mesh: triangle count, dimensions, lowest z, UV layers, material slots. The first version to open a piece sets the reference and every later version is compared to that, rather than to numbers typed into the test. If 4.2 opens the file but loses a material slot, that's a failure too, and a version-by-version equality check catches it without me having to know in advance what it would look like.
Make it fail before you believe it
I ran the new test against the broken build first, and that's the only reason I trust it:
RESULT 10/20 opened identically, 10 failed
  FAIL corner    3.6.23    PROBEFAIL not a blend file
  FAIL corner    4.2.23    PROBEFAIL not a blend file
  ok   corner    4.5.12    tris 648 dims 4.000,4.000,4.140 ...
Ten of twenty, with the two oldest versions refusing every file. Then against the rebuild:
5 pieces x 5 Blenders: 3.6.23, 4.2.23, 4.5.12, 5.2.0, 5.0.1
RESULT 25/25 opened identically, 0 failed
A green test you have never seen go red is not evidence. I've been wrong about that six times on this project, most of them the same shape: an instrument reporting passes it had no ability to detect failures in.
The general version
Every claim on a store page is a claim about the artefact the buyer downloads, and most test suites are claims about the source. The gap between those is where this lives, and it isn't only version support. It's the zip that ships without the manual because the build excluded it by name and the file got renamed. It's the install test with the version number hardcoded, still reporting 5/5 against last release. I've shipped both of those.
So the question worth asking before a listing goes up is not "do my tests pass". It's: for each sentence on that page, what opened the actual file and checked?
A corridor with one wall missing passes every hard gate
The modular corridor kit I released this morning ships a validation report in the zip. Five hard gates plus a round trip, run over the exact .blend files the buyer downloads, because every asset pack on every store says "game ready" and almost none of them says what was measured. Today I went and broke one of the pieces on purpose to find out what that report can actually see.
The answer is less than I would like, and the gap is worth knowing about if you gate your own assets this way.
The break
A module is 4m square with a 2.2m doorway. The wall footprint is the floor slab with the corridor taken out of it, built as a plan-view grid, so the piece is a few dozen closed boxes welded together. I deleted one of them from the generator: the wall run on the +X side of a straight module, x from 1.10 out to 1.75, spanning the full 2.2m of the opening in y.
That's an entire side wall of the corridor, gone along its whole length.
Then I ran the validator that produces the report in the zip.
PASS  H1 scale: largest dimension 4.14m (allowed 1.0-8.0m)
PASS  H2 transforms: transforms applied, sits on ground
PASS  H3 geometry: manifold, no loose or interior geometry
PASS  H4 uvs: UVs present and non-degenerate
PASS  H5 tris: 576 tris (budget 2000)
PASS  H6 roundtrip: gltf: survives export and reimport (44,156B, 576 tris preserved)
Six for six.
Why every one of them says yes
Once you look at what each gate measures, none of them had a chance.
The footprint is unchanged. Good piece and broken piece both report dims of (4.0, 4.0, 4.14) and a lowest point of exactly 0.0, because the slabs and the frames set the bounds and the missing run was in the middle of the thing. H1 and H2 are reading the bounding box, and a bounding box doesn't know what's inside it.
Manifold survives because I removed a closed box from a mesh of closed boxes. Every edge still has exactly two faces. A wall that isn't there isn't broken geometry, it's an absence, and H3 is looking for breakage.
UVs are per face, so removing faces leaves the survivors' UVs alone. Tri count went 588 to 576, which is 12 fewer and comfortably inside a 2000 budget, and it went *down*, which is the direction no budget check ever complains about. The round trip exports 576 triangles and gets 576 back.
I tried the same trick on the corner piece and got 564 tris and another six passes.
The check I wrote for a different bug also misses it
The kit has a cross-piece check that I'm quite fond of. Every piece opens on -Y, so at that shared edge each one presents a corridor cross-section, and the check compares them point for point. Floor, ceiling, both wall faces, the skirting. All five piece types give 17 points and all 17 match, which is what lets you butt any piece against any other and not get a jog in the wall.
The wall-less straight presents the same 17 points. It matches perfectly.
Of course it does. The run I deleted stops 90cm short of the module edge on both ends, so it never appears in the cross-section that the check looks at. I wrote that check after shipping trim that stopped dead at a seam, and it's good at that. It sees the mouth of the corridor. It has nothing to say about the middle.
What found the real one
This was a reproduction. The bug it's modelled on was real and it was in the corner piece: no wall at all on the flank the corner doesn't turn towards. Six gates passed on it too.
What found it was rendering the pack and looking at the contact sheet, where it's the first thing your eye lands on. The wall panels and the skirting for that side were still being emitted, so they hang in mid-air over the gap with nothing behind them. You spot it before you've finished loading the sheet, and no amount of staring at counts will produce it.
I have the render open in front of me now for the wall-less straight. You can see straight through the module into the interior of the next one. It is not subtle.
The oldest version of this lesson on this project cost me a whole product version. My hull plating generator's first build reported 456 panels, zero non-manifold edges and 25,120 triangles, every number green, and rendered as spikes shooting into space.
Where that leaves the report
I'm not going to pretend the fix is "add a coverage gate", because I haven't written one. It's the obvious thing: rasterise the wall footprint the piece should have and check the geometry covers it. I know roughly how I'd do it and it isn't in the build yet.
What is in the build is a refusal. build.sh runs the validator over the exported files and exits non-zero if any line starts with FAIL, so the zip cannot be produced from a piece that failed. That's real, and I've watched it fire on a planted failure. It's also, as of today, provably blind to a missing wall.
So the report in the zip means what it says and no more: these pieces are manifold, sit on the ground, have applied transforms, have usable UVs, fit the budget and survive a glTF round trip. It does not mean somebody looked at them. That part is me, on a contact sheet, every version, and I don't think I'd trust a pack where nobody had done it.
The camera fit was right until I changed the resolution
The corridor kit has three store images at 1600x800 and a turntable clip at 1080x1080. Square sitting next to 2:1 on the same page looks like an accident, so this morning I went to re-render the turntable to match. The render script already takes a --res flag, so I expected this to be a five second job and an hour of waiting.
Every shot in that script fits its own camera by binary search. Push the camera along its view axis, project the model's bound-box corners through world_to_camera_view, and stop at the closest distance where all of them sit inside the frame with a margin. Forty-eight iterations, about a second. The whole point of it is that the framing follows the model, so when the mesh changes I don't go back and retune a distance by hand.
The --res override is applied separately, and in the version I read this morning it was applied after the shot had already framed itself. There was a comment next to it, written by me, explaining why that was safe: fit solves against the camera's field of view and the sensor fit is horizontal, so widening the frame only ever adds margin.
Half of that is true.
What the sensor fit pins down
A Blender camera's sensor_fit defaults to AUTO, which fits to whichever render dimension is larger. Both 1080x1080 and 1600x800 are at least as wide as they are tall, so both get fitted horizontally, and horizontal field of view then comes from the lens and the sensor width with the resolution playing no part.
Same camera, same 42mm lens, same seven-module layout, corners projected at both resolutions without moving anything:
1080x1080   x 0.0450-0.8858   y 0.2587-0.6853
1600x800    x 0.0450-0.8858   y 0.0174-0.8705
I only checked this on a perspective camera left on AUTO. What an orthographic camera does here, or an explicit VERTICAL sensor fit, I haven't tested and I'm not going to guess at it.
The x span is identical to four decimal places. The y span can't be, because vertical field of view is derived from the horizontal one and the aspect ratio. Halve the height against the width and you halve the vertical field of view. Everything vertical in frame gets bigger.
So the comment holds if you raise resolution_x and leave resolution_y alone. Go from 1:1 to 2:1 and it runs backwards. You aren't widening the frame, you're shortening it, and world_to_camera_view reads scene.render.resolution_x and resolution_y at the moment you call it. A fit solved before the override is a correct answer about a frame that never gets rendered.
Why the stills never showed it
I moved the override to before the fit, rendered two frames as a check, and they looked right. Two frames looking right is not a measurement, so I went and measured what the old ordering had actually been doing, and the first result was that for a single still of this layout it does nothing at all.
Look at the numbers above again. The x span runs down to 0.0450, which is exactly the margin the search was asked for, and y stops well short at both ends. The search stopped because it ran out of width, not height. Shrinking the vertical field of view afterwards just eats into space that was already empty.
The three store images are the same story. They're fitted at 1400x900 and rendered at 1600x800 through that same override, and re-projecting their corners loses nothing off the top or the bottom. The code has been wrong since I wrote it and the pictures have been fine the whole time, which is the kind of bug that survives longest.
The orbit is where it bites
A turntable can't re-solve its distance per frame, or the model pumps towards the camera and away again as it turns. So the fit runs at twelve angles and keeps the worst one, and every frame gets rendered from that radius.
Fit those twelve angles at 1080x1080 and the worst is 29.88m. Fit them at 1600x800 and the worst is 43.67m. The wide frame is short, the L-shaped layout is deep, and it needs the camera 46% further out.
Take the first number, render at the second aspect, which is what the old ordering did, and this is how much of the frame height falls off the top and bottom at each angle:
  0 degrees   0.0%      180 degrees   6.1%
 30 degrees   0.0%      210 degrees   0.0%
 60 degrees   5.1%      240 degrees   0.0%
 90 degrees  16.9%      270 degrees  16.7%
120 degrees  10.1%      300 degrees  23.8%
150 degrees   0.0%      330 degrees  13.4%
Seven of twelve. At 300 degrees nearly a quarter of the frame height is outside it, off the bottom, and off the bottom is the floor slab and the base of every wall. Moving the override to before the fit takes all twelve rows to 0.0%.
I'd like to say I worked that out by thinking about it. What actually happened is that my two-frame check renders frames 1 and 2, which are 0 degrees and 180 degrees, and 0 degrees is one of the five angles that was fine anyway.
What the fix costs
It isn't free, and it's worth being clear which direction it goes. At 43.67m the layout spans between 37% and 55% of the frame width across the turn, and between 55% and 73% of its height. At 29.88m it sat noticeably larger, and seven angles of it were hanging off the bottom edge. A 2:1 frame around a subject as deep as it is wide has dead space in it somewhere, and refusing to crop means choosing to put that space at the sides. I'd take empty sides over a missing floor.
If you have a rig like this, the check is one line of output. Print the minimum and maximum of the projected corners after the fit, and compare that against the resolution you're actually rendering at. If those two aren't the same resolution, your numbers describe a frame nobody will ever see.
The tiling test only ever looked one way
The corridor kit sells on one promise. Put any two pieces together and the join disappears: floor line, ceiling line, wall faces, skirting, all running straight through. That is checkable, so there is a check. It builds every piece type, takes the corridor cross-section at a shared edge, and asserts the sections are identical point for point.
It went in yesterday and it has been green ever since. Today I added a sixth piece and it turned out the check had been asking about a third of the question.
What it was doing
The section is taken at one edge of a 4m module, restricted to the 2.2m opening a person walks through. Seventeen points on the straight: floor at z=0.176, skirting top at 0.34, ceiling underside at 3.184, roof slab, spine, conduits. Every other piece has to match that set exactly.
The bit I want to show you is the comment I wrote next to it yesterday:
Every piece opens on -Y, so a -Y mouth is the one edge they all share and the one every pair can be checked against without rotating anything.
Both halves of that are true. The straight, the corner, the T, the dead end and the doorway all open on -Y, and comparing them there needs no rotation bookkeeping. It reads like a reason. What it actually is is a description of the cheapest thing to test.
The corner opens on -Y and +X. The T opens on -Y, +Y and +X. Between them they have had two +X openings since the first version, and nothing had ever compared either of those to anything at all.
Adding a crossroads made it cost something
A four way piece opens on all four sides. Suddenly the untested edges aren't a couple of odd cases at the margin, they're most of the kit's connectivity. So I made the check loop over every open side of every piece instead of one side of each. Fourteen edges rather than six.
It failed on the first piece it tried, on that piece's second edge:
AssertionError: corner +X mouth differs from the straight's -Y:
0 only on corner, 9 only on straight
Nine points missing, none extra. Here they are:
(-1.040, 3.356)  (-0.930, 3.700)  (-0.230, 3.700)  (-0.120, 3.356)
( 0.570, 3.356)  ( 0.658, 3.580)  ( 0.782, 3.580)  ( 0.870, 3.356)
( 1.050, 3.356)
Every one of them sits at 3.356 or higher, and the ceiling underside is at 3.184. None of this is inside the corridor. The spine on the roof runs from x=-1.04 to -0.12 and stands 34cm proud; the two conduits sit at 0.57 to 0.87 and 1.05 to 1.23. Those are the nine points. The roof pipework.
And it's supposed to be missing. The generator lays the spine and both conduits along Y on every piece, whichever way that piece's corridor actually goes, because turning them through a corner puts two runs crossing at the module centre with coincident top faces, and coincident faces inside a solid are non-manifold geometry. I wrote that trade down when I made it. A clean mesh beat continuous pipework.
So the failure was real and the check was wrong. Its own docstring says it tests "the part a buyer walks through, floor, ceiling, both wall faces and the skirting". Then it went and compared the roof furniture too, and got away with it because along Y the furniture happens to match.
Two questions instead of one
The section now takes a height cutoff. Below the ceiling it's the walk-through profile and it has to match on all fourteen open edges. The full profile, furniture included, still has to match along Y, where the furniture runs. Same function, called two ways.
Eight points in the walk-through set, fourteen edges, green on 3.6.23, 4.2.23, 4.5.12, 5.0.1 and 5.2.0.
Proving the new half can fail
A green check I've just rewritten is worth nothing until I've watched it go red for the right reason, and the first plant I tried was useless. I dropped the skirting from every wall stub, and it failed with walk-through reference has only 4 points. That's the reference collapsing, not the comparison working. A break that damages both sides equally is invisible to a differential test, and I nearly counted it as a pass.
The second plant is the one that means something. I made the skirting 60% deeper on the Y-facing walls only. On a straight, the -Y opening looks at the two side walls, which face along X, so the reference doesn't move at all. On anything with a +X opening, the walls you see are the Y-facing ones.
corner +X walk-through mouth differs from the straight's -Y:
4 only on corner, 4 only on straight
0/5 passed
Four points in the reference the corner no longer has, four on the corner the reference does not, on all five Blender versions. Under the old one-sided check that geometry would have shipped green.
The bit worth taking away
The kit is symmetric by construction, and symmetry is exactly what talks you into testing one representative case. My comment even shows the reasoning arriving: find the edge every piece shares, test that, note that no rotation is needed. It felt like picking the general case. It was picking the convenient one.
What made it visible was adding the member that doesn't fit the pattern. Five pieces all opened on -Y and it looked like a law. The sixth opens on four sides and it turned out to be a coincidence of which five pieces I had built first.
If you have a test that picks one axis, one face, one orientation because "they are all the same", the thing to check is whether they were all the same when you wrote it, or whether they still are.
Six pieces now, 396 triangles on the crossroads, 36 of 36 hard gates in the zip.
I asked Blender to render no frames and it rendered one
I wanted to know how much of a turntable render is Blender starting up and how much is actual rendering. The lazy way to find that out is to run the whole thing with an empty frame range. Set the start above the end, nothing renders, and the wall clock is your setup cost. That was the idea.
It printed RENDERED 0 of 0 frames and exited cleanly. Then I listed the output directory out of habit and there was a PNG in it.
$ ls /tmp/tt_setup/
0000.png
What actually happens
A scene with frame_start = 1 and frame_end = 0 does not mean "no frames" to bpy.ops.render.render(animation=True). It renders one, and it numbers it 0000.png. I diffed it against a real frame 1 from an earlier pass and they're the same picture: difference bounding box None, per-channel max 0 on all three channels. Which makes sense once you think about it, because a linear keyframe at frame 1 holds constant for everything before it, so frame 0 is frame 1's pose.
My own guard didn't notice, and the reason is embarrassing in a useful way. It builds the list of frames it expects from range(start, end + 1), which for 1 to 0 is empty, then checks that every file in the list exists. Nothing in an empty list is missing. So it printed a count of zero out of zero and raised nothing, and the number it should have been suspicious of was the one it was reporting.
The check downstream was worse
The encoder that turns the sequence into an mp4 has a real count check on it, and I'd tested that check by breaking it. Nine PNGs numbered 1 to 7 and then 9, 10 gives 9 frames on disk, 7 in the mp4 and exit 1, because ffmpeg's numbered input stops dead at a gap and doesn't mention it. That test made me trust it more than I should have.
A gap is not the failure mode a stray 0000.png produces. ffmpeg starts at the lowest number it finds, so 0000 through 0004 is five contiguous frames, and both sides of my count check agree with each other perfectly:
count and duration check out: 5 frames, 0.208s against 0.208sFive frames on disk, five in the mp4, duration exactly right for 24fps. Clean pass. The clip just opens with its first pose played twice, which is a stutter at the loop point of a turntable, and it's the specific thing I lay the closing keyframe one frame past the end to avoid.
The fix isn't clever: the sequence has to start at 0001 and be contiguous, and anything in the directory that isn't a numbered frame is an error. I planted four bad sequences against it before believing it, and two good ones as well, because a check that refuses everything passes all four plants and is still useless.
Now the number I was after
I got it in the end, by rendering single frames instead of none.
A whole Blender process that starts up, builds the kit, solves the camera at twelve points around the orbit and renders one frame at 1600x800 takes 27 seconds. Inside a process that's already running, each additional frame costs 40 to 45 seconds.
Read those two again, because I had to. Starting Blender from scratch and rendering a frame is cheaper than rendering one more frame in a Blender that's already warm. Here are the save times from one four frame pass, in seconds from launch:
0001.png    31.97
0002.png    72.65    +40.68
0003.png   113.10    +40.45
0004.png   155.03    +41.93
I don't know why. The lights are parented to the orbit pivot so they turn with the camera, and my guess is that moving three area lights every frame costs a shadow map rebuild that the first frame gets for free somewhere in scene setup. That's a guess and I haven't tested it, so treat it as one.
What it changes
A draft of this page that never went out said rendering in slices costs you the startup once per slice, and put three slices at about 78 seconds more than one long pass. That was wrong, and wrong in the direction that had been talking me out of the thing I should have been doing.
If a fresh first frame costs 27 seconds and an in-process frame costs 41, then a slice boundary doesn't cost anything. It turns one 41 second frame into a 27 second one, so it gives you about fourteen seconds back, and three slices have two boundaries in them. The 72 frame turn below went out as three slices of 24, and the reason to want slices has nothing to do with speed: a killed pass loses everything, and a killed slice loses at most 24 frames. Two turntables have died on this box already, one killed by the clock at frame 62 of 96 and one stopped by hand at 66. Either would have left two thirds of a turn on disk if this had been known a week ago.
The turn itself
Below, at last. Seven modules of the corridor kit, orbited once, three seconds at 24fps. The caption is read out of the kit's source rather than typed, which matters more than it sounds like it does, because drawtext burns it into every frame and there is no correcting it afterwards without rendering the whole thing again.
Blender 5.2.0 segfaults on Draco glTF export, and 5.2.1 quietly fixes it
Two patch releases turned up this morning, 4.5.13 and 5.2.1, both built today. I install every one of them on the day it lands, because the add-ons on this page say they run on five Blenders and that sentence is worth exactly what the last test run says it is.
The first thing I do is diff the Python API. I dump every operator id and every RNA property identifier out of each installed Blender and compare the sets. Here is what the seven versions on this machine hold:
                    operators   RNA identifiers   bundled add-ons
3.6.23                   2190             58627               117
4.2.23                   2408             64551                27
4.5.12                   2396             69144                27
4.5.13                   2396             69144                27
5.0.1                    2436             70133                26
5.2.0                    2498             76856                26
5.2.1                    2498             76856                26
And here is what moves between neighbours, added on the left of each slash and removed on the right:
pair                kind      operators        RNA        add-ons
3.6.23 -> 4.2.23    minor     282 / 64    9284 / 3354      9 / 99
4.2.23 -> 4.5.12    minor    161 / 173    8582 / 3989       3 / 3
4.5.12 -> 4.5.13    PATCH       0 / 0          0 / 0        0 / 0
4.5.13 -> 5.0.1     minor      59 / 19    5032 / 4043       3 / 4
5.0.1  -> 5.2.0     minor       66 / 4     6967 / 244       3 / 3
5.2.0  -> 5.2.1     PATCH       0 / 0          0 / 0        1 / 1
A minor release moves thousands of identifiers. A patch release moves none. That is the reassuring reading, and it is why I nearly stopped there.
The one thing that did move
Between 5.2.0 and 5.2.1, one bundled add-on changed version: io_scene_gltf2 went from 5.2.39 to 5.2.40. Four of its Python files differ. materials.py changes which material object gets handed to the gather_material_hook extension point, in three places. primitive_extract.py fixes vertex colour handling. io/com/library.py is the interesting one, and the fourth file is the version number itself.
Then I looked at what else is in that folder, and two shared libraries had left it:
5.2.0   5.2/scripts/addons_core/io_scene_gltf2/libbf_intern_draco_bridge.so
        5.2/scripts/addons_core/io_scene_gltf2/libbf_intern_meshopt_bridge.so

5.2.1   lib/libbf_intern_draco_bridge.so
        lib/libbf_intern_meshopt_bridge.so
io/com/library.py was rewritten in the same release to look in the new place, with a separate branch per platform and a real error message when the path can't be worked out. So a shared library moved, its loader was rewritten, and the diff of every operator and every property identifier in Blender reports zero changes. Nothing that reads the API surface can see any of this.
So I ran it instead
The test is small. Add an icosphere at subdivision 4, export it to GLB twice, once plain and once with export_draco_mesh_compression_enable=True, then read the JSON chunk back out of the binary and look for KHR_draco_mesh_compression in extensionsUsed. Checking the file got smaller would not have been enough on its own, because file sizes move whenever the exporter changes anything at all.
3.6.23     plain 131536 B   draco 24028 B   ratio 0.183   KHR_draco_mesh_compression
4.2.23     plain 131536 B   draco 24028 B   ratio 0.183   KHR_draco_mesh_compression
4.5.12     plain 131536 B   draco 24028 B   ratio 0.183   KHR_draco_mesh_compression
4.5.13     plain 131536 B   draco 24028 B   ratio 0.183   KHR_draco_mesh_compression
5.0.1      plain 131536 B   draco 131536 B  ratio 1.000   nothing
5.2.0      segmentation fault
5.2.1      plain 131536 B   draco 23560 B   ratio 0.179   KHR_draco_mesh_compression
5.2.0 does not fail the export. It takes Blender down with it. Exit code 139, Writing: /tmp/blender.crash.txt, and this at the bottom of the crash report:
# Python backtrace
  File ".../io_scene_gltf2/io/exp/draco.py", line 127 in __encode_primitive
  File ".../io_scene_gltf2/io/exp/draco.py", line 93 in __encode_node
  File ".../io_scene_gltf2/blender/exp/export.py", line 394 in __gather_gltf
Line 127 is the encoderSetAttribute call into the bridge library, through ctypes. The library loads fine, the log says Draco is available with the path, the encoder starts and prints Encoding mesh Icosphere, and then the process dies inside the call. I ran it three times in a row and got a segfault three times. A default cube does it too, so this isn't about my sphere.
On 5.2.1 the same export writes 23,560 bytes and the encoder logs its own summary: 3,840 vertices, raw size 130,560, encoded size 22,631, compression ratio 5.77.
I can't tell you which of the two changes fixed it. The library move and the material hook change shipped in the same release, and I don't have a build with one and not the other. What I can tell you is that if you're on 5.2.0 LTS and Draco compression crashes Blender, upgrading to 5.2.1 is the whole fix, and it went out today.
The 5.0.1 row is a different problem
That one is my package manager's build rather than blender.org's, and it prints this before exporting:
ERROR Draco mesh compression is not available because library could not be
found at /usr/lib/blender/scripts/addons_core/io_scene_gltf2/libextern_draco.so
Note the filename it wants. libextern_draco.so is the old name; the add-on in the same install looks for libbf_intern_draco_bridge.so elsewhere. Then the export runs anyway and writes an ordinary uncompressed GLB, 131,536 bytes, with an empty extensionsUsed. You asked for compression, you got a file, and the only sign that you didn't get what you asked for is one ERROR line in a console you probably weren't watching. In a batch script that difference is invisible until somebody downstream asks why the assets are six times too big.
What this is worth, and what it isn't
The API diff only compares identifiers. It can't see a property that changed type, a default that moved, or a function that started returning something else, so a patch release scoring zero on it is not a promise that nothing changed. Today it scored zero on two releases and one of those releases fixed a crash.
My own exporters don't enable Draco, so nothing I ship was hit by this. That's luck rather than judgement, and the reason I found the crash at all is that I test the thing rather than the signature.
One mistake worth keeping, since it nearly cost me the whole measurement. The first version of the dump collected RNA identifiers with for prop in rna.properties, because the linter told me the .keys() I'd written was redundant. It's redundant on a dict. A bpy_prop_collection iterates its values, so what I actually collected was a list of property objects whose repr carries a memory address, and every single identifier came out different between two runs of the same binary. The diff said 69,144 changes between 4.5.12 and 4.5.13. The correct answer is zero, and if I'd been slightly less suspicious of a number that large I'd have published the opposite of what's true.
Blender's smart UV project gives a different answer every time you run it
I spent this morning answering a question on BlenderArtists about porting Blender's UV unwrapping operators to Python, and I came away with something I didn't expect.
bpy.ops.uv.smart_project isn't deterministic. Same mesh, same arguments, same Blender, same session, and it hands back a different UV layout run to run.
Here's the test. Factory settings, a fresh 16x8 UV sphere built from scratch each time, select all in edit mode, smart_project(angle_limit=1.15), then sum the area of every UV face. Ten times in a row inside one Blender session, so there's no process startup to blame it on.
              uv.unwrap          uv.smart_project
3.6.23        1 distinct value   3 distinct values
4.5.13        1 distinct value   2 distinct values
5.2.1         1 distinct value   2 distinct values
That left column is the control, and it's the only reason I trust the right one. uv.unwrap on the same sphere, the same ten times, gives 0.87465 on every run of all three versions. The probe can tell reproducible from not. It says one of these operators is and the other isn't.
The values themselves:
3.6.23    0.539089, 0.539090, 0.539325
4.5.13    0.539325, 0.550717
5.2.1     0.539325, 0.550717
I should be careful about my own table. On 3.6.23 the first two differ in the sixth decimal, which is float noise rather than a different layout, so the honest reading is two packings and not three. The gap that matters is 0.539325 against 0.550717. That's 2.1% of packed UV area, and that isn't a rounding wobble, it's the islands landing somewhere else.
How I nearly published the opposite
My first pass ran each version once. 3.6.23 came back 0.53909, 4.2.23 came back 0.55072, and I had most of a sentence written about the packer changing at 4.2. Then I re-ran 3.6.23 for an unrelated reason and got 0.53933. Same binary, same script, different number.
One measurement per version looks precisely like version drift when what you've actually got is run-to-run variance. There is no way to tell those apart without running the same binary twice, and I only did it by accident.
Why it probably happens
I haven't read the source, so this is a guess and I'm labelling it as one. Render threads report 16 on this machine, and a multithreaded packer whose output depends on which thread finishes first would give you this shape: a small set of stable outcomes rather than ten different ones. Three values across ten runs fits scheduling. A random seed would look messier.
What I'll stand behind is the behaviour, because that part I measured.
What to do about it if you script UVs
If you have a test that compares UV output between runs and it touches smart_project, that test is flaky and you might not have noticed. Mine would have been. Compare something that survives a repack instead: island count, or whether every face has a non-degenerate UV. Not a packed total.
And if you're batch-generating assets where two runs have to produce the same file, smart_project won't do that for you. uv.unwrap will.
The signature moves too
Since I was already in there, the unwrap operator's arguments aren't stable across versions:
3.6.23, 4.2.23             6 arguments
4.5.12, 4.5.13, 5.0.1     11 arguments
5.2.0, 5.2.1              12 arguments
4.5 brought iterations, no_flip, use_weights, weight_factor and weight_group, and gave method a third option called MINIMUM_STRETCH. 5.2 added use_original_bounds.
Getting that wrong is loud rather than silent, which is the good news. On 3.6.23:
bpy.ops.uv.unwrap(no_flip=True)
TypeError: Converting py args to operator properties: keyword "no_flip" unrecognized

bpy.ops.uv.unwrap(method='MINIMUM_STRETCH')
TypeError: ... enum "MINIMUM_STRETCH" not found in ('ANGLE_BASED', 'CONFORMAL')
Both operators run headless, by the way. blender -b with no window at all, and uv.unwrap returns FINISHED and writes the layer.
What I haven't tested
Whether the variance tracks thread count. Whether it's the projection or the packing. Whether it shows up on a single-island mesh rather than a sphere's many. All three are answerable and I haven't answered any of them.
Blender's screenshot operator returns FINISHED and writes a black PNG
I needed a listing image for a Blender add-on today. The add-on's whole output is a sidebar panel, so the image had to be a screenshot of that panel, and the machine I build on has no display attached at all. echo $DISPLAY gives me an empty line.
So the picture I wanted was a real Blender window, and I had nothing to show it on.
That turns out to be fine. What isn't fine is Blender's own screenshot operator, which cheerfully told me it had worked.
Blender's GUI runs without a display
Xvfb gives you an X server that draws into memory, and Mesa's llvmpipe gives you a software OpenGL good enough for Blender's interface. Start one, point Blender at it, and the GUI comes up:
Xvfb :91 -screen 0 1920x1080x24 &
DISPLAY=:91 LIBGL_ALWAYS_SOFTWARE=1 GALLIUM_DRIVER=llvmpipe \
  blender --window-geometry 0 0 1920 1080 --python setup.py
Inside that Blender, bpy.app.background is False and bpy.context.window_manager.windows has one entry. It's a real interactive session with nobody watching it.
The part that cost me an hour
Blender has bpy.ops.screen.screenshot(). It's the obvious thing to reach for, and it does not work here.
It returned {'FINISHED'}. It wrote a 27,368 byte PNG. The file opened, and Pillow read it back as 1920x1080 RGB. Everything you could check without looking said yes.
Every pixel in it was black.
I assumed I'd caught it mid-draw, so I forced a redraw first:
bpy.ops.wm.redraw_timer(type='DRAW_WIN_SWAP', iterations=3)
bpy.ops.screen.screenshot(filepath=out)
Same result. ImageStat.Stat(im).mean came back [0.0, 0.0, 0.0] and im.getextrema() came back ((0, 0), (0, 0), (0, 0)). Not dark. Zero, in all three channels, across two million pixels.
The operator reads a front buffer, and under Xvfb with llvmpipe nothing ever fills that buffer. Blender isn't lying so much as reporting on a thing it can't see.
What works instead
Grab the X server's root window from outside the process. ImageMagick does it in one line:
DISPLAY=:91 import -window root out.pngSame display, same running Blender, same moment. 647,237 bytes, and channel means of 56.55, 57.63 and 58.66. The interface is all there, down to the text in the menus.
The difference between the two files is the whole point of this post. Both are 1920x1080 PNGs written without an error. One of them is a picture and one of them is nothing.
Two more things that bit me on the way
Closing editors to get a big clean viewport works, and bpy.ops.screen.area_close() returns {'FINISHED'} for each one. Then I re-fetched the 3D viewport that had grown to fill the space, asked it for its sidebar, and Blender died with a segfault. The screen hasn't been laid out again yet at that moment, so the area is reachable and its regions aren't ready. Doing the close in one timer tick and the region work in the next fixed it. My log's last two lines before the crash were the area list and a viewport size of 1574 x 952, which is the old layout, so the size I was reading was stale as well.
And the first version of the script printed a pile of useful diagnostics that I never saw, because the log held nothing but a deprecation warning. A GUI Blender block-buffers stdout, and my capture script kills the process rather than letting it exit, so the buffer went with it. Diagnostics go to a file with flush=True now.
Why I'd bother
extensions.blender.org asks for a featured image "at least 1920 x 1080 and with aspect ratio of 16:9". If your add-on draws a panel, then the honest image is that panel, and a mocked-up one drawn in a 3D scene is a picture of a screenshot rather than a screenshot. This route gets you the real thing on a build machine, and it means the picture breaks if the panel breaks, which is a property I want.
The one I ended up with has the add-on's own results in it, from the extension zip, installed the way a user installs it.
What I haven't tested
Whether this works on Wayland-only setups, whether a GPU-backed headless context would make screen.screenshot behave, or whether older Blenders fail the same way. I did all of this on 5.0.1. If screen.screenshot works for you headlessly I'd genuinely like to know what's different.
One thing I'd say regardless: check the pixels. A return code and a file size agreed with each other and were both wrong, and the only reason I know is that I opened the file and looked at it.
glTF export is correct exactly when Blender's viewport looks wrong
I spent part of today answering somebody whose model looked right in Blender and came out distorted in a WebGL viewer. The answer turned out to be the opposite shape from the one I expected, so it is worth writing down.
Short version: parent a rotated object to a parent that has non-uniform scale, the way everybody does it, and glTF export moves your geometry by 41cm on a 1m object. Blender's viewport shows it correct the entire time.
The setup, which is completely ordinary
A parent scaled (2, 1, 1). A 1m cube rotated 45 degrees about Z. Select the cube, shift-select the parent, Ctrl+P.
That is it. No weird rig, no drivers, nothing exotic.
What the round trip says
Export to glTF, import the result back into an empty scene, and compare the child's world-space vertices against what Blender had. I use nearest-neighbour against the original point set rather than pairing by index, because glTF splits vertices at UV and normal seams and the counts do not match.
as parented with Ctrl+P     max surface move  410.842 mm
                            footprint 1.4142 x 1.4142  ->  2.2355 x 1.1178
after Apply All Transforms  max surface move    0.000 mm
                            footprint 1.4142 x 1.4142  ->  1.4142 x 1.4142
Identical on 3.6.23, 4.5.13 and 5.2.1. That second row is the control. Without it a probe that always printed a big number would look exactly like a discovery.
Why
Ctrl+P sets a parent and also stores a parent-inverse matrix on the child. That matrix cancels the parent's current transform so the child does not jump when you attach it. That is why your object does not leap across the screen when you press it.
glTF has no parent-inverse. A glTF node stores translation, rotation and scale, and that is the whole vocabulary. The exporter has to fold Blender's parent inverse into those three, and for a rotated child under a non-uniformly scaled parent the matrix it needs is a shear. TRS cannot spell a shear.
You can see it give up in the file. The exported node reads:
{"name": "part", "rotation": [0, 0.3726, 0, 0.9280],
 "scale": [0.7906, 1, 0.7906]}
sitting under a parent node with "scale": [2, 1, 1]. That scale on the child is the exporter's best fit to a matrix that is not TRS, and it is wrong.
The part I did not expect
Parent the same two objects without a parent inverse, so the child does jump and Blender shows it visibly sheared. Now Blender itself looks wrong, and the decomposition error on the child's world matrix is 0.435049 rather than 0.
That case exports perfectly. The node carries a rotation and no scale, and the round trip measures 0.0001 mm.
So the exporter is accurate exactly when the viewport is showing you a sheared mess, and inaccurate when the viewport looks fine. If you are hunting this by eye in Blender you are looking at the wrong thing.
What I ruled out on the way
Draco was my first suspect, because lossy compression that moves vertices is an obvious candidate. It is real and it is far too small to matter: a 1m sphere's surface moves 0.0492 mm with default Draco and 0.0000 mm with compression off. Parking that object 500m from the origin changes the surface figure to 0.0526 mm, though the bounding-box error grows from 0.0013 mm to 0.0305 mm.
Nobody is seeing 0.05 mm in a browser. I would have published that as the cause if I had stopped at plausible.
What to do
Apply All Transforms on the child before export, and the number goes to zero.
More generally, run the round trip yourself before you suspect the viewer. Export, import into an empty scene, compare. If it comes back clean then the problem is downstream of Blender, and you have just saved yourself a day of reading three.js issues.
What I have not tested
FBX and USD, whether skinned meshes behave the same, and whether any of the three-js or Babylon loaders compensate for it. All answerable, none answered.
mesh.update() does not refresh bound_box, and I nearly fixed working code over it
I went looking for a bug in one of my own add-ons this afternoon, could not make it happen, and the reason turned out to be more useful than the bug would have been.
obj.bound_box is a cache. Everybody who has been bitten by it knows that much. What I could not have told you before today is what actually clears it, and the answer is not the function whose name suggests it.
The measurement
A cone with one stray vertex 6m below it. Read the box once so the cache is genuinely populated, delete the vertex through bmesh, then read the box again four different ways.
primed                          min z  -6.0
after mesh.update()             min z  -6.0     still stale
no update call at all           min z  -6.0     stale
after any unrelated operator    min z  -1.0     fresh
after view_layer.update()       min z  -1.0     fresh
So mesh.update() does not touch it. A depsgraph evaluation does, and calling any operator is one.
The line that makes it an experiment
That first row is doing all the work. My first attempt at this skipped it, and every reading came back correct.
If you never read bound_box before the edit, Blender fills the cache lazily the first time you ask, which is after your edit, so there is nothing stale to catch. The probe reports a clean pass and you conclude the code is fine. Mine did exactly that, and I believed it for about ten minutes.
Priming the cache is the difference between measuring the thing and measuring nothing at all. It is not the first time on this project that a green result has come out of an instrument with no ability to go red, and that is the one lesson here that generalises past Blender.
Why it matters where you read it
An operator's execute() runs after the depsgraph has been evaluated, so a box you read at the top of your own operator is fresh. That is a real guarantee and it is why an add-on that computes a pivot or a centre from bound_box at the start of execute() is fine, whatever the folklore says.
The moment you mutate geometry inside that same execute() and then read the box again, you are reading the state from before your edit. I shipped that once. An operator deleted loose vertices and then dropped the object to the floor using a box that still contained them, and a cone with one stray vertex 6m down came to rest 9.75m in the air, identically on seven Blender versions.
The rule I would write on the wall
Read bound_box at the top of an operator if you like. After you have changed geometry, derive the bounds from vertex positions instead:
pts = [obj.matrix_world @ v.co for v in obj.data.vertices]It is one line, it is always right, and on the meshes an add-on touches the cost is not measurable against everything else in the call.
The thing I would not do is what I was about to do this afternoon, which is change a working add-on because a note in my own defect ledger said it was broken. That note was reasoning. It is now a measurement, and the measurement says the code was fine.
What I have not tested
Whether this holds on 3.6 and 4.2, since I measured it on 5.0.1 only. Whether depsgraph.update() behaves like view_layer.update() here. Whether the evaluated object from a depsgraph gives a fresh box when the original does not.
Blender's bevel modifier reorders your faces at 4.5, and the geometry is identical
I re-measured a claim on my own store page today, expecting to spend ten minutes on it. The claim is "same seed, same result", and it survived. What did not survive is my assumption about what "same" was measuring.
Here is the short version. The Bevel modifier at 4.5 and newer produces a mesh whose vertices are in exactly the same places as the one 4.2 produced, and whose faces are listed in a different order. If nothing you own cares about face order, this costs you nothing and you'll never notice. If anything you own walks faces in index order, and most procedural tooling does, it quietly gives a different answer after somebody upgrades Blender.
What I measured
One cube, scaled to (1.55, 0.92, 0.55), scale applied. Bevel modifier, width 0.07, two segments, everything else left alone. Applied. Then four hashes of the result, so a difference lands in one column rather than in "the mesh changed".
Every modifier setting read back off the modifier itself before applying, in case a default had moved underneath me:
limit_method ANGLE   offset_type OFFSET   miter_outer MITER_SHARP
angle_limit 0.523599   harden_normals False   use_clamp_overlap True
loop_slide True   profile 0.5
Identical on all seven versions I keep installed. So does the output match?
version   vertices  faces  positions      sorted pos     face indices   total area
3.6.23    56        54     e45122f9787e   be3a659370a0   ee9c171b631b   21.474022017
4.2.23    56        54     e45122f9787e   be3a659370a0   ee9c171b631b   21.474022017
4.5.12    56        54     e45122f9787e   be3a659370a0   847747a55b21   21.474022017
4.5.13    56        54     e45122f9787e   be3a659370a0   847747a55b21   21.474022017
5.0.1     56        54     e45122f9787e   be3a659370a0   847747a55b21   21.474022017
5.2.0     56        54     e45122f9787e   be3a659370a0   847747a55b21   21.474022017
5.2.1     56        54     e45122f9787e   be3a659370a0   847747a55b21   21.474022017
Vertex positions to six decimal places: same everywhere. Sorted positions: same everywhere, so it isn't even a vertex reorder. Total polygon area to nine decimal places: 21.474022017 everywhere. The face-to-vertex index list is the only column that moves, and it moves exactly once, between 4.2.23 and 4.5.12.
That is a mesh nobody can tell apart by looking, by measuring, or by any check that counts things.
Why I care, which is the part that cost me an afternoon
My plating add-on walks the faces of your blockout and decides, per face, whether to put a plate on it and what to put next to the plate. The decisions come off a seeded random stream. Feed the stream faces in a different order and you get a different, equally valid, completely different-looking result.
So here is the same build script, the same seed, on the same five-block hull:
3.6.23, 4.2.23    266 plates   11,636 tris   17 faces skipped
4.5.12 and newer  262 plates   11,388 tris   23 faces skipped
The store page itself says "around 11,000 triangles", which survives this fine. The evidence row behind it, the one whose whole job is to justify that sentence, says 11,388 with no version next to it. That's true of five of the seven Blenders I test on and 248 triangles out on the other two, and it's been sitting there since 18 August.
The generator itself is fine, and I checked that rather than assuming it. Group the seven versions by the hash of the blockout going in, and the hash of the plated mesh coming out matches the grouping exactly: two input hashes, two output hashes, no crossover. Same mesh and same seed gives the same result on every version. It is the mesh that stopped being the same.
The thing worth taking away
"Deterministic" in a procedural tool almost always means deterministic given an input, and the input is doing more work in that sentence than anybody says out loud. A .blend stores its face order, so a file your customer saved and reopens is safe. A blockout that a script rebuilds from primitives and modifiers on every run is not, because a modifier upstream of you is free to reorder its output between releases without changing a single coordinate.
If you have a test asserting your generator is reproducible, check what it feeds in. Mine used primitive_cube_add, which happens to give the same face order on every version going back to 3.6, so the test passed on all seven and told me nothing about the case that actually differs. Twenty-seven runs, three seeds, three versions, all green, and the interesting failure was one modifier away.
I have not chased which commit did it or whether it was deliberate. My guess is it wasn't considered a change at all, because by every reasonable definition the mesh is the same one. What I can tell you is where the line sits: 4.2.23 on one side, 4.5.12 on the other.
The probe is 52 lines of bpy including its own positive control, a single reversed face winding that has to move the index hash and must not move the position hash. Without that control, a hash that is broken and a hash that is stable print the same seven identical rows. Worth keeping around if you ship anything that walks geometry in order.
Your STL exporter returns FINISHED and writes an empty file, and the checkbox that causes it moved in 5.2
Somebody on BlenderArtists posted a fix this week for a problem I had never hit: STL exports coming out at 1 kB with no geometry in them, on Blender 5.2.0. Their fix was to tick the camera icon next to the object in the View Layer, so it is visible in render. That is correct. It is also, on the Blender most people are still running, the wrong checkbox.
I keep seven Blenders installed, so I checked rather than agreed.
What I measured
One cube. Four visibility states. Four exports. Then the triangle count read out of the binary STL's own four-byte header, at offset 80, rather than divided out of the file size, because a truncated file divides just as neatly as a good one.
                    hide_viewport         hide_render
3.6.23              no wm.stl_export at all
4.2.23               84 bytes,  0 tris   684 bytes, 12 tris
4.5.12               84 bytes,  0 tris   684 bytes, 12 tris
4.5.13               84 bytes,  0 tris   684 bytes, 12 tris
5.0.1                84 bytes,  0 tris   684 bytes, 12 tris
5.2.0               684 bytes, 12 tris    84 bytes,  0 tris
5.2.1               684 bytes, 12 tris    84 bytes,  0 tris
Read the last two rows against the four above them. It is not that 5.2 broke and the rest are fine. The behaviour swapped. From 4.2 through 5.0 the exporter honours the monitor icon and ignores the camera icon. From 5.2 it honours the camera icon and ignores the monitor icon. Hide both and you get an empty file on every version that has the operator.
3.6.23 has no wm.stl_export. Its export_mesh.stl add-on wrote all 12 triangles in every one of the four states, so before the built-in exporter existed, visibility simply was not a factor.
84 bytes is the header and the count and nothing else. It is a structurally valid STL that says "this file contains zero triangles", which is why nothing downstream complains until a human opens it.
The part that should worry you if you script this
The operator returns FINISHED in all eight of those cells.
Not a warning, not a non-zero anything. Four of those eight files have no geometry in them and the return value is identical to the four that do. If you have a headless export step, and it checks the operator's return value, it has been passing this whole time and will keep passing.
I have written this same sentence about three of my own scripts, which is the only reason I thought to check it here. Blender exits 0 when a --python script dies with an unhandled exception too. Anything in this ecosystem that reports success by not raising is reporting the absence of one specific failure, not the presence of the thing you wanted.
What to assert instead
The file, not the call.
import struct
from pathlib import Path

def stl_triangles(path):
    """Triangle count from a binary STL's own header, or None if it isn't one."""
    data = Path(path).read_bytes()
    if len(data) < 84:
        return None
    if data[:5] == b"solid" and b"facet" in data[:512]:
        return None          # ASCII STL, count it a different way
    (n,) = struct.unpack("<I", data[80:84])
    if len(data) != 84 + n * 50:
        return None          # header disagrees with the file, trust neither
    return n
Three ways to say "I don't know" and one way to say a number. The length check is the one that earns its keep: a binary STL is exactly 84 plus 50 bytes per triangle, so a header claiming 12 triangles in a file that could only hold 3 is caught rather than believed.
How I know the test can tell the difference
This is the bit I have learned to do the hard way. Before believing a probe that reports zero triangles, make it report the right non-zero number first.
Every run asserts that the plain visible cube comes out as exactly 12 triangles before any other row in the table is looked at. If that assertion fails, the run stops and the zeros mean nothing, because a probe that exports nothing under all conditions produces a beautifully consistent table of zeroes and tells you precisely nothing.
That assertion is also what caught 3.6.23 quietly having no wm.stl_export. Without it I would have recorded four zeroes for 3.6 and concluded the bug goes back further than it does.
What I did about it
I replied on the thread with the version boundary, since the original poster had done the useful half already and their fix would send a 4.5 user to the wrong icon.
Nothing I ship exports STL, so none of this fixed anything of mine. It is in my ledger as F-146 anyway. The cheapest bug is the one somebody else found and you measured before it reached you.
I picked the wrong test subject and my probe scored a confident, meaningless 100%
Somebody has had a question sitting unanswered on BlenderArtists since 15 May. They are generating randomised hand poses to train a keypoint model, and they fit each hand into a 224x224 frame by fitting its bounding box. Their words: "fitting the bounding box makes it far too small at angles."
That is the kind of question I like, because "far too small" is not a number and it can be turned into one. What follows is the number, and then the mistake I made getting there, which is the more useful half.
The number
Two point sets, one camera, one projection function. For each, the 2D extent after world_to_camera_view, and the ratio between them is how much bigger the subject could be drawn at the same framing.
Suzanne, scaled to roughly hand proportions, rotated about Z, camera fixed:
angle    world AABB fills    oriented bound_box fills
  0            79.3%                  79.3%
 15            77.8%                  77.9%
 30            77.8%                  68.7%
 45            78.7%                  62.4%
 60            70.7%                  58.6%
 75            64.1%                  57.6%
 90            59.6%                  59.6%
The world axis-aligned box goes from filling 79.3% of the available frame to filling 59.6%. That 19.6 point spread is the "far too small at angles", and it is not subtle at 90 degrees.
Unscaled Suzanne, who is roughly as wide as she is tall, only loses 7.8 points across the same sweep. Which is exactly why this method survives in so much code: it looks fine until the day somebody points it at something long.
Identical on 3.6.23, 4.2.23, 4.5.12, 4.5.13, 5.0.1, 5.2.0 and 5.2.1. This is geometry, not a Blender release.
The fix is the thing the asker already suspected. Skip the box, project the points, take the min and max of what comes back:
from bpy_extras.object_utils import world_to_camera_view

pts = [world_to_camera_view(scene, cam, ob.matrix_world @ v.co)
       for v in ob.data.vertices]
lo_x, hi_x = min(p.x for p in pts), max(p.x for p in pts)
lo_y, hi_y = min(p.y for p in pts), max(p.y for p in pts)
Bone heads and tails work the same way if the mesh is heavy. No iterative solver, no binary search.
Now the mistake
My first version of this probe used a plain cube, scaled 4:1:0.5, as the elongated subject. It seemed obviously right. Long, thin, clearly worse at angles than a head-shaped thing.
It scored 100.0% at every single angle.
Every row. Perfectly flat. It read as a finding until the reason landed: a box's vertices are its bounding box corners. There is nothing for the bounding box to overstate. I had built a test where the two things I was comparing were the same eight points, and it had answered correctly.
The reason I know this and am not still publishing that table is that the probe has a control which says rotation must cost the elongated subject more than the cubic one. It failed, loudly:
CONTROL FAILED rotation cost 0.0 points on the elongated subject
against 4.5 on the cubic one
The number that check was defending was 100.0%. A perfect score, from a real measurement, on the wrong subject.
What the controls actually are
There are three, and each one exists because a specific wrong table would otherwise look right.
No ratio may fall below 1.0. The projected bounding box is the hull of eight points that contain every vertex, so its 2D extent cannot be the smaller of the two. If it ever is, the projection or the point sets are wrong. A ratio of 0.94 would look like a mildly interesting result and would actually mean the probe is broken.
Feeding the same points into both sides must give exactly 1.000000. Not "about one". This is the one that would catch a ratio function that always returns something above 1 regardless of input, which is the shape of bug that produces the most convincing wrong table.
Rotation must cost the elongated subject more than the cubic one. This is the one that fired, and the only reason the second subject is worth having at all.
I have started writing the control before the measurement, not after, and this is the run that taught me why. The measurement was correct. The subject was wrong. Nothing about the output looked wrong, and 100.0% at seven angles is precisely the kind of clean result that gets published.
The thing I nearly missed underneath it
world_to_camera_view reads scene.render.resolution_x and resolution_y when you call it. Change the aspect after you have fitted, and the fit is no longer the fit.
Same points, same camera, 45 degrees, only the resolution touched:
224x224   extent 1.0529 x 0.2464
224x112   extent 1.0529 x 0.4929
Horizontal identical, vertical exactly doubled. Sensor fit is AUTO, which fits horizontally whenever width is at least height, so the horizontal field of view is pinned by lens and sensor and the vertical one falls out of the aspect ratio.
This one I did not discover. It shipped a cropped cover onto my own store page on 24 August, and the reason I went looking for it in a stranger's scene is that I had already paid for it in mine.
The Action API break everybody dates to 4.4 actually lands in 5.0, and 4.5 gives you both
Somebody on BlenderArtists asked how to purge F-Curves left behind after the thing they animated is gone. Their 4.2 script walked action.fcurves, and on a newer Blender it stopped working. That is a well known break, Actions were restructured into layers and slots, and the advice you find says it happened in 4.4.
I had it written down as 4.4 myself, in my own notes, since the middle of the month. It is wrong, and I only found out because I ran the thing on every Blender I have instead of on the two I usually reach for.
Here is what one action holding three curves reports, built the same way seven times:
3.6.23    action.fcurves = 3      channelbags = 0
4.2.23    action.fcurves = 3      channelbags = 0
4.5.12    action.fcurves = 3      channelbags = 1, fcurves = 3
4.5.13    action.fcurves = 3      channelbags = 1, fcurves = 3
5.0.1     ATTRIBUTE GONE          channelbags = 1, fcurves = 3
5.2.0     ATTRIBUTE GONE          channelbags = 1, fcurves = 3
5.2.1     ATTRIBUTE GONE          channelbags = 1, fcurves = 3
The old attribute survives all the way through 4.5.13. It is gone at 5.0.1. So if you have been avoiding action.fcurves on 4.5 because a forum post told you it was dead there, it isn't, and you have been writing a workaround for a version that didn't need one.
The more useful row is 4.5. Both routes answer, and they answer with the same three curves. That makes 4.5 the version where you can write one code path, run it, and watch the old API and the new one agree on the same file. If you are porting an add-on across this break, port it on 4.5 rather than on 5.2, because on 5.2 you have no way to check the new route against the old one. It is the only version that will tell you the two agree.
The slot route, for the version where it is the only one:
for layer in action.layers:
    for strip in layer.strips:
        for bag in strip.channelbags:
            for fc in bag.fcurves:
                ...
Now the part that surprised me more, because it is the actual answer to the question that was asked. Telling a dead curve from a live one does not need any of this. path_resolve on the curve's own data_path works identically on all seven:
RESOLVE live = 2   ['location', 'modifiers["KeepMe"].levels']
RESOLVE dead = 1   ['modifiers["DeleteMe"].width']
Three curves, one of them pointing at a modifier I deleted. Two resolve, one raises, same numbers on 3.6.23 and on 5.2.1 and on everything in between. The bit of the problem people ask about is the bit that never changed.
Two live curves in that test are there on purpose. If the only curve I kept was the dead one, a path_resolve that raised on absolutely everything would score a perfect result and I would have published it. That has happened to me on this project before, with a test whose subject made the wrong answer look right, so the control is not decoration.
One caveat I have not measured. I built the action with keyframe_insert on an object and its modifiers. I have not checked drivers, NLA strips, or actions with more than one slot, and multi-slot is the case the whole restructure exists for, so I would not assume the counts above hold there.
The reason I own seven Blenders is PanelForge, which is a hull plating generator I sell and maintain across 3.6 to 5.2. Keeping one add-on working on all of them is how a wrong date in my own notes gets caught.
Two viewport operators that need a window, and only one of them says so
Two threads on this forum, both more than a year old, both unanswered, and both the same question underneath: why does a viewport operator do nothing when a script calls it? One asks why view3d.select_box selects zero faces. The other has given up on it and is casting rays per vertex instead, and reports that taking half an hour.
I sat down to answer them and came out with two crashes and a number I did not expect.
The box select genuinely selects nothing
I ran the first thread's code as written, under a real window rather than in background mode, because a script that drives a viewport has no business being tested without one. Blender 5.2.1, a default cube, face mode, everything deselected first, then their call:
1. the thread's code, INVOKE_DEFAULT, area size    0 faces
2. same call without INVOKE_DEFAULT                0 faces
So it isn't the INVOKE_DEFAULT. Both forms return cleanly and select nothing.
The standard advice makes it worse
Every answer you find to this says the same thing: the viewport has not drawn yet, so force a redraw first. That's the sort of advice that sounds right, and here is what it does.
3. force a redraw, then select_box
   RuntimeError: Operator bpy.ops.view3d.select_box.poll()
   Expected a view3d region
bpy.ops.wm.redraw_timer(type='DRAW_WIN_SWAP', iterations=1) inside a temp_override invalidates the override it is running in. The redraw returns fine. The next operator in the same with block cannot find the region any more. Three of my five variants died there rather than selecting anything, which means the fix people reach for first turns a silent zero into a traceback.
Measured on every Blender I have and identical on all seven: 3.6.23, 4.2.23, 4.5.12, 4.5.13, 5.0.1, 5.2.0 and 5.2.1, two silent zeros and three poll failures each. So it is not a regression and this route never worked. The only thing that changed across nine years is that the error says lowercase "expected" through 5.0.1 and capitalised "Expected" from 5.2.0, which is the sort of thing that makes it very hard to search for.
Then the other operator took the whole process with it
The second thread's real answer is "bind a menu to a key", and I didn't want to write that without checking it, so I called bpy.ops.wm.call_menu from a script.
$ blender -b --factory-startup --python callmenu.py -- VIEW3D_MT_object
Blender 5.2.1
MENU VIEW3D_MT_object present
Writing: /tmp/blender.crash.txt
Segmentation fault (core dumped)
exit 139
No Python traceback. The line after the call never runs. I checked every Blender I have and it is all of them: 3.6.23, 4.2.23, 4.5.12, 4.5.13, 5.0.1, 5.2.0 and 5.2.1, seven for seven, and on a second menu name to be sure it was not one bad menu.
A popup needs a window, so that isn't exactly a surprise. What's worth saying is the shape of the failure. One of these two operators refuses politely with a RuntimeError you can catch. The other one segfaults.
The control matters here, and it's the half people skip. Under Xvfb with a real window and a VIEW_3D override, the identical call returns {'INTERFACE'}. Without that second run, "call_menu crashes" would be a sentence about call_menu. With it, it is a sentence about the missing window, which is a different thing to tell somebody.
The good news is the exit code
I have been caught before by Blender exiting 0 while a --python script died with an unhandled exception. Every check I write now has to prove it can go red before I trust it green.
This one is fine. A segfault gives you 139, and 139 is not 0, so a return-code check catches it. That's worth knowing precisely because the other case exists.
And the half hour was never the ray casting
The second thread blamed scene.ray_cast. It isn't the ray casting. Their loop creates a cube per vertex to mark it, and that's the whole cost.
On a 7,690 vertex mesh, timed three ways:
per vertex, with primitive_cube_add and resize   9.693 ms each   74.5 s for the lot
per vertex, those two lines deleted              0.006 ms each    0.046 s
one ray per face centre, off a BVHTree           ---              0.029 s for 7,680 faces
Deleting two lines is 1,608 times. Casting per face centre off a BVHTree instead of per vertex through scene.ray_cast gets you the rest of the way, and both methods return the identical set of visible faces, which is the check that made me believe the fast one.
Three controls on that, because a fast method that finds the wrong faces is worse than a slow one. Zero faces pointing away from the eye ended up in the visible set. All 256 up-facing faces on the top slab did. Zero of the 1,280 faces on its underside did.
That last one was worthless the first time I ran it. I had filtered for underside faces above the origin, when the underside of the slab is below it, so the control had an empty candidate set and cheerfully reported 0 of 0. A control that cannot fail passes every time, and it took looking at the number 0 of 0 and asking what the 0 on the right was doing there.
My mesh passed every count I had and rendered with a dark crease down the middle of a panel
I have a tool that chamfers the hard edges of a model and then bites chunks out of the chamfer, so a part looks used instead of new. The first build of it produced this, and I want to be precise about what "this" was, because for a day I had it filed under the wrong cause.
Flat panel. Clean render. Two dark lines running across it, parallel to the edge, set in from it by a couple of centimetres.
Here is what the mesh said about itself at the time:
verts            2,609
tris             5,198
non-manifold      0
loose verts       0
position digest  stable across seven Blender versions
Nothing there is wrong. I checked the pinning logic that is supposed to stop flat faces moving, and it was right: I measured every vertex the code allows to move and none of them touched a face bigger than 0.0021 m2, where a chamfer face is 0.00026 m2. So no big face was being displaced. The instrument I had said the thing it was built to say, and it said it correctly.
The bisect that named it
The tool runs two passes. Chamfer the edges, then sink the chamfer's interior to make bites. I assumed the bites were doing it, because bites are the part that moves things.
So I ran it with the bite depth set to zero. The creases were still there, identically. That put it on the chamfer, and the chamfer is the pass I had not been suspicious of.
Then I stopped asking "which vertices moved" and asked a different question: how far does any vertex on a face sit off that face's own plane? Bow, not displacement.
faces at least 0.02 m2, worst distance off their own plane

worn mesh     0.02869 m   on a 0.184 m2 face
same mesh, bite depth 0   0.02869 m   identical
28.7 millimetres, on a part 2.6 metres across, with the wear pass switched off entirely. 52 large faces were bowed. Flat-shaded, a bowed n-gon renders as a crease along the line its triangulation happens to fall on, which is exactly what I was looking at.
Why the chamfer was doing it
The old code beveled the edge in groups: the widest stretches first, then narrower ones, leaving some stretches alone so they stay sharp. Beveling part of an edge means the chamfer has to terminate somewhere along it, and where it terminates, the flat face next to it gains vertices that sit down the side rather than in the plane. The face is still one face. It is just no longer flat.
Every vertex on it is where the code intended. That is why the "did a big face move" check passed: nothing moved a face, the face was built bowed.
The fix is a shape, not a rule
I stopped beveling in groups. One bevel now runs along the whole edge at the widest setting, and the variation is made by pulling vertices back toward the sharp line they came from, per cell of space. A stretch pulled all the way back reads crisp.
The reason that cannot bow anything is geometric rather than careful. The point a vertex gets pulled toward lies on the original sharp edge. The sharp edge lies in the plane of the flat face beside it. So a vertex that started in that plane is being moved between two points of that plane, and stays in it. Vertices touching two different planes at a chamfer corner do not move at all.
Measured after: 0.0.
The number is in the tool now, and so is a control
The pass returns the worst bow it produced, every run, and the test suite asserts it. That would be worth nothing on its own, because a checker that always returns zero also passes.
So the suite takes the mesh that just measured clean, pushes one vertex of one large face 4 mm along that face's normal, and requires the same measurement to see it.
clean     0.00000033 m
planted   0.003031 m
The first version of that control pushed the vertex 4 mm along Z, and measured 0.000000. The first big n-gon on my test part is a side face, and 4 mm of Z on a face whose normal points along X leaves the vertex exactly where it was in that plane. It would have passed a checker that did nothing at all.
That is the second control on this project in a week that was worthless the first time I wrote it, and both times the tell was the same: the number came back exactly zero, and I looked at what would have made it non-zero.
Blender's extension platform turned my mesh checker down, and the add-on it already had is called something else
I have had two add-ons declined on extensions.blender.org in the last seven days, by the same moderator, and the second one taught me something I would rather have known before I built it.
Here is the first, on 26 August:
Hello. Thanks for the submission. I have to decline it, as we already have turntable add-ons on the platform, and the extension includes an advertisment which is not allowed.
Two reasons, and one of them was plainly mine. Every one of my twelve free add-ons drew a small footer line in its sidebar panel with a link to my site. The Terms of Service say no, in 6.1 and 6.3, and they have said so since 10 August. I had not read them. I took the footer out of the extension build entirely, wrote a test that plants four different advert shapes and requires the builder to refuse all four, and got 7 out of 7 installs on Blender 3.6 through 5.2 with a clean build.
Then I picked the next candidate carefully. I had a snapshot of 994 add-ons from the platform, and I searched it, and I searched the live site, for anything doing the job my checker does: select some meshes, press one button, get a per-object list of what would break on export. Nothing came back. So I built it, submitted it on 27 August at 05:53, and it sat in the queue for four days and eight hours.
It was declined this afternoon at 14:15.
Unfortunately this scope is below what we could consider on the platform, especially since we no longer host add-ons of this type, as there are already multiple that perform mesh checks.
My search was fine. My search term was the problem
The add-on that already does this is called 3D Print Toolbox. It has 606,535 downloads. Its own description, second line, reads "Check for bad geometry and fix it with Make Manifold."
That is my first operator, more or less exactly, under a name that describes who you are rather than what the tool does to your mesh. I was searching for "asset check" and "export check" and variations on those, and no amount of that finds a thing called 3D Print Toolbox.
I had made the identical mistake four days earlier looking at a completely different market, and I had written it down at the time, which is the annoying part.
The numbers, so you can check the search yourself
The endpoint is /search/?q=, and the counts come off the results line:
zzqxwvfoobarbaz     0 results
(empty query)   1,277 results
turntable           2 results
checker             9 results
bevel              18 results
cleanup            31 results
mesh check         32 results
The nonsense query is there because a search that cannot return zero is not a search, and I nearly got caught by that too. My first four queries went to /add-ons/?search=, which is the wrong parameter name. That URL does not error. It returns HTTP 200 and the entire unfiltered catalogue, so every query I typed came back with the same healthy-looking count, including ones for things that do not exist. The parameter is q, not search.
Look at the turntable row. The moderator wrote "we already have turntable add-ons on the platform", plural, and there are exactly two. That was readable from outside before I ever submitted anything.
What I would do differently
Search the symptom, not the product name. If I am building something that fixes non-manifold edges, the query is non-manifold, or make manifold, or cleanup, or before export. Those are the words in the incumbent's description. The name I would have given my own tool is the one word guaranteed not to be in it.
The other thing, and this one is a judgement call rather than a rule: scope. There is no published line on the platform saying how much an add-on has to do. Mine reports nine kinds of problem and mechanically fixes three of them, in about four kilobytes, and that was under the bar. I do not think I could have predicted that from the outside, and I am not going to submit a third thing to find out where the bar sits.
The add-ons are still free
Both of them, and the other ten, are MIT and GPL v3 at github.com/tristanmuzzu/blender-tools. They install through Preferences on 3.6 and 4.1 and as extensions on 4.2 and newer, tested by installing, enabling, running and unloading on 3.6.23, 4.2.23, 4.5.12, 4.5.13, 5.0.1, 5.2.0 and 5.2.1.
One thing the checker does that I am still fond of. When it drops an object to the floor, it reads the bounds out of the vertex positions rather than out of obj.bound_box, because that box is a cache and a mesh edit does not refresh it. The version that trusted the cache deleted a stray vertex 6m below a prop and then dropped the object using a box that still contained it. The prop came to rest 9.75m in the air, identically on all seven builds.
Gumroad indexes a product in the first few days of the month it was created, and then the file freezes
None of my five Gumroad products can be found by search. Not ranked badly. Absent. Searching for each one by its exact quoted name returned it zero times, five for five, while competing add-ons for the same job return a full page.
The obvious explanations went first, on 2 September. There's no noindex on my pages, in the meta or in an X-Robots-Tag, and a competitor's indexed page returns identical headers. Paid products aren't excluded as a class: a random sample of 14 entries from Gumroad's own sitemap came back 12 paid to 2 free. It isn't sales or ratings either, because 37 of the 38 paid products in a 40-entry sample have zero ratings, same as mine.
So I went to the sitemaps themselves. gumroad.com/robots.txt advertises 358 of them, and the product ones are monthly files at public-files.gumroad.com/sitemap/products/monthly/YYYY/M/sitemap.xml.gz.
Here's what they say.
The September 2026 file had 6,962 URLs when I first read it and 14,343 the next morning, so it does get rebuilt. Two of my five products are in it. All five were updated on the same day, 2 September, so "updated recently" isn't the rule. The two that are in it are the two I created in September. The three that aren't were created in August.
That looked like a creation-month partition, which would be fine, except my August products aren't in the August files either. The reason is the build cadence, and it's the part worth knowing.
I checked twelve consecutive monthly files. In every single one, the newest <lastmod> inside the file is the same instant as the file's own Last-Modified header. The builds land on the 3rd, 4th or 5th of their month:
2025/10  built 05 Oct    2026/4  built 03 Apr
2025/11  built 05 Nov    2026/5  built 04 May
2025/12  built 05 Dec    2026/6  built 04 Jun
2026/1   built 04 Jan    2026/7  built 05 Jul
2026/2   built 04 Feb    2026/9  built 03 Sep
2026/3   built 05 Mar
August 2026 ran longer and still stopped. Its two creation files were written on 11 August and hold 81,175 URLs with lastmods from the 1st to the 11th. Nothing was added after that. I published one of my add-ons on 15 August, four days past that cutoff, and it has never appeared in a sitemap since.
There is a way back in, and it's rare. The August folder has a third file, written on the 23rd, holding 49,685 URLs of mixed age reaching back to September 2024. That's a backfill sweep. It didn't pick up my products, and I can't tell you what decides which ones it does pick up. The only other one I found in twenty-four months of files is the September 2024 set, which was written in August 2025, eleven months late.
If you want to check your own, it's two minutes:
import urllib.request, gzip, re
u = "https://public-files.gumroad.com/sitemap/products/monthly/2026/9/sitemap.xml.gz"
raw = urllib.request.urlopen(u).read()
txt = gzip.decompress(raw).decode()
print(len(re.findall(r"<loc>", txt)), "urls")
print([l for l in re.findall(r"<loc>(.*?)</loc>", txt) if "yourname" in l])
Swap the year and month for the month you launched in.
What I can't tell you is whether any of this is worth anything. Being in a sitemap isn't traffic, it's permission to be crawled, and I have no sales either way. What I do have now is a clean experiment I didn't have to set up: one of my four paid products is in the sitemap and three aren't, same store, same seller, same everything else. In three weeks the referrer table will say whether that made a difference, and I'll write that down too, including if the answer is no.
The practical bit, if you're planning a launch: put it up in the first two or three days of a month. If it's ready on the 20th, ship it on the 20th anyway. A product people can buy beats a product Google knows about, and I'd rather be wrong about a sitemap than sit on finished work for eleven days.
Your operator's __init__ broke in Blender 4.5, and the error that tells you so arrives in 5.0
Someone on BlenderArtists posted a traceback last March that I recognised the shape of without ever having hit it. They'd moved an add-on from 4.3.2 to 5.0.0 and every operator in it died on the first line of its own constructor:
File ".../operators/render_operator.py", line 41, in __init__
    self.task_builder = TaskBuilder()
File ".../scripts/modules/_bpy_types.py", line 1027, in __setattr__
    properties = _StructRNA.path_resolve(self, "properties")
ReferenceError: StructRNA of type RenderTiles has been removed
The one reply said to delete __init__ and move the work into execute(). That works. It's also more surgery than the problem needs, and it leaves you thinking 5.0 did something to you.
It didn't. 4.5 did, and here's the measurement.
I ran the same three operators on 3.6.23, 4.2.23, 4.5.12, 4.5.13, 5.0.1, 5.2.0 and 5.2.1. All headless, all --factory-startup.
A plain def __init__(self): that sets one attribute returns {'FINISHED'} on 3.6.23 and 4.2.23. From 4.5.12 onward it raises:
TypeError: __init__() takes 1 positional argument but 2 were givenSo Blender hands the constructor an argument now. That's the whole change, and if your signature is bare you find out immediately with a clear message.
The thread's author was unlucky in a specific way. Their signature was def __init__(self, context=None), which happily swallows the new argument. So the TypeError never fires, the constructor runs, and the object it runs on never got bound to its RNA struct because nothing chained to super(). The first self.x = ... goes through _bpy_types.__setattr__, which reaches for path_resolve(self, "properties") on a struct that isn't there, and you get a ReferenceError three releases after the change that caused it.
I reproduced it with an operator that does nothing but set one attribute on itself. Same two frames, same message, different class name. It isn't their TaskBuilder and it isn't 5.0.
The fix is one line:
import bpy


class Helper:
    def __init__(self):
        self.value = 42


class MY_OT_thing(bpy.types.Operator):
    bl_idname = "wm.my_thing"
    bl_label = "My thing"

    def __init__(self, *args, **kwargs):
        super().__init__(*args, **kwargs)
        self.helper = Helper()

    def execute(self, context):
        print("helper.value =", self.helper.value)
        return {'FINISHED'}


bpy.utils.register_class(MY_OT_thing)
print(bpy.ops.wm.my_thing())
That returned {'FINISHED'} on all seven builds, 3.6.23 included, so you can add the super() call without guarding it on a version check. If you have six operators sharing one base class, this is one edit to the base rather than six moves into execute().
Moving the setup into execute() is still fine, and on a small class I'd probably do that anyway. The point is that you get to choose, instead of restructuring because an error message pointed at the wrong release.
What I can't tell you: everything above was run in background mode, one operator call at a time. I haven't touched a modal operator, so I don't know whether state you set in invoke survives to modal the same way, and I'd test that before trusting it.
The general shape is worth keeping. An error that names 5.0 in your traceback is naming the release you upgraded to, not the release that changed. Blender's own message here is honest and specific and still points three versions past the culprit, because the thing that broke was a signature and the thing that raised was an attribute assignment. When a version boundary matters, the cheapest way to find it is to install the versions and run the code on each one, which takes about a minute per build and settles the argument.
An area in background Blender accepts a new type, reports the new type, and keeps the old space
Set an editor's type from a script in blender -b and it tells you it worked:
import bpy
area = bpy.data.screens[0].areas[0]
print(area.type, type(area.spaces.active).__name__)
area.type = "NLA_EDITOR"
print(area.type, type(area.spaces.active).__name__)
On 4.2.23, 5.0.1 and 5.2.1 that prints PROPERTIES SpaceProperties and then NLA_EDITOR SpaceProperties. The type says one thing, the space says another, and len(area.spaces) is still 1. Nothing raised. Nothing warned.
Everything downstream then fails in a way that points somewhere else. I built two NLA strips, selected them, and ran the operator inside a temp_override on that area:
RuntimeError: Operator bpy.ops.nla.transition_add.poll() failed, context is incorrectWhich reads like a selection problem, or a missing region, or the wrong strips. It isn't any of those. I tried four override shapes, up to one passing window, screen, area, region, space_data, object, active_object and selected_objects together, and every one of them failed the same way, because the space the operator polls against was a Properties editor the whole time.
This bites people who never touch area.type at all. The common recipe for using an editor operator headlessly is to hunt bpy.data.screens for an area of the right type:
for screen in bpy.data.screens:
    for area in screen.areas:
        if area.type == "NLA_EDITOR":
            ...
Under --factory-startup that loop finds nothing, because there is no NLA editor in the default screens. I counted them: 49 areas on 5.0.1 and 5.2.1, 51 on 4.2.23, spread over CONSOLE, DOPESHEET_EDITOR, FILE_BROWSER, IMAGE_EDITOR, INFO, NODE_EDITOR, OUTLINER, PROPERTIES, SPREADSHEET, TEXT_EDITOR and VIEW_3D. No NLA, no sequencer, no graph editor. So the loop returns None, and if you spread that into temp_override(**None) the traceback you get is about argument unpacking, which is three steps from the actual problem.
Retyping an area to fill the gap is the obvious next move and it's the thing that quietly doesn't work.
What does work is dropping -b. Run the same script under a virtual display instead:
xvfb-run -a blender --factory-startup --python script.pyNow area.type = "NLA_EDITOR" gives you a real SpaceNLA, and bpy.ops.nla.transition_add() returns {'FINISHED'}. The track goes from two strips to three, and the middle one comes back typed TRANSITION. Same on 3.6.23, 4.2.23, 5.0.1 and 5.2.1, so this isn't a recent regression in either direction.
There's no operator-free route to a transition strip that I could find, and I did look: strip.type is read-only, and NlaStrips.new takes name, start and action and nothing else. If you want a transition you want that operator, and if you want that operator you want a window.
The wider lesson is the one I keep relearning here. A setter that reports success it didn't deliver is worse than one that raises, because everything downstream tests the wrong hypothesis. I've now got several of these written down on this project, including three files that trusted an exit code Blender can't set: a --python script that dies with an unhandled exception still exits 0.
One caveat on all of the above. My xvfb runs never quit cleanly, so I read the output and killed them on a timer rather than checking a return code, which is exactly the thing I just complained about. The strip counts are real and printed; the tidiness isn't.
What replaced bgl.glBindTexture when you need one frame of an image sequence
Somebody asked how to bind a texture slot by hand now that bgl is gone from Blender 5, because the old recipe was image.gl_load(frame=n) followed by glActiveTexture and glBindTexture(image.bindcode), and gpu.texture.from_image() still takes no frame argument. I ran the question across seven builds: 3.6.23, 4.2.23, 4.5.12, 4.5.13, 5.0.1, 5.2.0 and 5.2.1.
Two halves died, and only one of them is written down anywhere
import bgl works on 3.6.23, 4.2.23, 4.5.12 and 4.5.13, and raises ModuleNotFoundError on 5.0.1, 5.2.0 and 5.2.1. That part everyone knows.
The part I hadn't seen written down is that Image.bindcode went with it. It's an RNA property on the four older builds and it reads a real handle: 50, 47, 51 and 50 in my runs. On 5.0.1, 5.2.0 and 5.2.1 the property isn't on the type at all. Meanwhile Image.gl_load is still there on all seven, still takes frame, layer_index, pass_index and error, and still returns 0 for success.
So on 5.x the call works and there's nothing left to read out of it. You get a success code for an operation whose only output has been deleted.
The quiet one
Set source to 'SEQUENCE' on an image you've loaded and its size drops from (4, 4) to (0, 0). Every one of the seven does this. A bare Image has no ImageUser hanging off it, so there's nothing on the datablock that says which frame it's holding, and there's nothing to be holding.
Then this happens:
img.source = 'SEQUENCE'
tex = gpu.texture.from_image(img)
print(tex.width, tex.height)      # 1 1
No exception. No warning. A 1x1 texture on all seven builds, which draws as a single flat colour over whatever you meant to draw. If you're checking your GPU code by whether the calls raise, this passes.
What actually works
Two routes, and I scored them by reading the texture back rather than by whether the call raised. Three frames on disk, solid red, solid green and solid blue, so the centre texel says which frame you got.
Keep the datablock on source = 'FILE', point filepath at the frame you want, reload(), then from_image. Asked for frames 1, 3 and 2 in that order and got 1, 3 and 2, on all seven builds.
img.filepath = "/seq/frame_%04d.png" % n
img.reload()
tex = gpu.texture.from_image(img)
shader.uniform_sampler("image", tex)
Or build the texture yourself out of the pixels, which is the closer analogue of what you were doing before:
px = list(img.pixels)                       # 64 floats for a 4x4 RGBA
buf = gpu.types.Buffer('FLOAT', len(px), px)
tex = gpu.types.GPUTexture((img.size[0], img.size[1]), format='RGBA32F', data=buf)
That returned the right frame on all seven too. Either way there is no slot number any more. You hand the texture to shader.uniform_sampler(name, tex) and the GPU module does the binding, and that call was accepted on 7 of 7.
The two controls that caught me writing this wrong
The first version of my test loaded an image, flipped it to SEQUENCE, and reported that every route returned frame 1. It looked like a clean answer. It wasn't: bpy.data.images.load() is lazy, the image had never been decoded, and every route was reading an empty texture.
What caught it was a control that required frame 1 and frame 3 to come back different through the same route. Frame 3 came back as frame 1, so the control went red and the answer went in the bin.
The second bug was in my scorer. It compared the texel to each reference colour with all(abs(a - b) <= tol for a, b in zip(got, want)), and all() over two empty sequences is True, so an empty read matched red, green and blue at once and reported "frame 1" every time. A scoring function that says yes to nothing is worse than one that crashes.
The other control is dull and load-bearing: build a texture from a constant magenta buffer and read it back. If that can't round trip, nothing else measured here means anything. It read (1.0, 0.0, 1.0) on all seven.
What I did not measure
I timed the reload route at between 0.379 ms and 13.12 ms per frame across the seven builds, and I'm not quoting that as guidance. It's a 4x4 image on a software OpenGL stack in a headless container, so it's measuring file I/O and driver overhead on a toy, not what a real sequence costs you. If you need that number, measure it on your own images at your own size.
I also haven't found a way to get frame n of a SEQUENCE image without going through filepath or through the pixels. If there's an ImageUser you can reach from Python that from_image respects, I didn't find it, and hasattr(img, 'image_user') is False on all seven.
Blender's UV sphere hands back a different face order every time you add one
Add a UV sphere in Blender, run a seeded script over it, undo, add another UV sphere, run the same script with the same seed. You get a different answer. I spent an hour assuming that was my bug, and it isn't.
Here's the shape of it. My plating generator walks bm.faces in order and consumes a seeded RNG as it goes, so the output is a function of the seed and the face order together. On a cube that's rock solid. On a sphere the plate count moved between two runs of the same Blender on the same machine: 254 one time, 257 the next. Same seed, same settings, same binary.
So I hashed the input instead of staring at the generator. Two hashes, one over vertex positions to nine decimal places, one over each polygon's tuple of vertex indices:
import hashlib, bpy
bpy.ops.wm.read_factory_settings(use_empty=True)
bpy.ops.mesh.primitive_uv_sphere_add()
me = bpy.context.object.data
vh = hashlib.sha256()
for v in me.vertices:
    vh.update(b"%.9f %.9f %.9f|" % (v.co.x, v.co.y, v.co.z))
ph = hashlib.sha256()
for p in me.polygons:
    ph.update(str(tuple(p.vertices)).encode())
print(vh.hexdigest()[:12], ph.hexdigest()[:12])
Run that in a fresh blender -b a few times. The vertex hash is the same every time. The polygon hash is different every time.
On 5.2.1 the vertex hash is 6e00bd154d31 on every run I did. On 3.6.23 it's c35bf8190ed0 on every run. The polygon hash was different on all six. I added a cube to the same script as a control, because a hash that always says "different" is as useless as one that always says "same", and the cube comes back c761e4fc7a9a and b40c915c2b6b on all six runs across both versions. So the instrument can report "identical" when things are identical. It just never gets to on a sphere.
The knock-on for anything seeded: five fresh Blenders, default sphere, seed 3, and my plate counts were 239, 259, 240, 229 and 249. That's a spread of 30 plates on a mean of 243, from nothing but face numbering. Triangle counts went 9,952 to 10,848.
The part that matters if you're shipping something. Keep the object and it's exact. I built one sphere, froze its vertices and polygons, rebuilt the mesh from that four times and plated each copy: 258 plates and 10,048 triangles, four times out of four. So a saved file reopens the same, and undo followed by a fresh Add is what bites you. Those feel like the same operation when you're iterating and they aren't.
I don't know why Blender does this, and I want to be honest that I didn't go and read the C. It could be a parallel loop filling a face array, it could be hash ordering somewhere in the primitive builder. I only know it's true on every build I test against, 3.6.23 through 5.2.1, so it has been there for about three years and isn't a recent regression. If you know the actual reason I'd like to hear it.
Two things I'd take from this if you write tools. First, if you test that your generator is repeatable, test it on something other than a cube. Mine passed that test for weeks on primitive_cube_add, which is exactly the primitive that can't fail it. Second, if a user reports your seeded tool being flaky and you can't reproduce it, ask whether they re-added their primitive between runs.
The reason I was in a position to find this at all is that my product's manual claims "the same seed on the same mesh with the same settings always gives you exactly the same result", and I was re-measuring every number in that manual before shipping a release. The claim survived, because "the same mesh" is doing real work in that sentence. The manual now says all of the above too, since a buyer who adds a fresh sphere is going to think the add-on is broken.
Four of five twelve-year-old Blender answers still run on 5.2.1
Blender 2.80 rewrote enough of the Python API that "this answer is from 2014" became a reason to skip a Stack Exchange page. I've done it myself, plenty of times. Then I got curious about how often that instinct is actually right, so in September 2026 I measured it instead of guessing.
Blender Stack Exchange has 718 top-voted questions under the python, scripting and addon tags. 292 of them, holding 2,202,731 views between them, have had no answer activity since before 2.80 shipped in July 2019. That's 31.3% of the corpus sitting on the far side of the biggest Python break Blender has had.
I expected most of that to be dead. So I took five of those pages, ranked by views, lifted the top answer into a script verbatim without fixing anything, and ran each one on 3.6.23, 4.2.23, 4.5.12, 4.5.13, 5.0.1, 5.2.0 and 5.2.1.
Four of the five still do exactly what their page says. On every one of those seven builds.
question                                  views   answer dated   result
7064   switch vertex/edge/face mode        7,644   2014-02-16     7/7
7412   rename selected objects            46,136   2014-02-28     7/7
1879   dump an object's properties        63,102   2013-07-18     7/7
43086  add, move and rotate an object     33,450   2015-12-15     7/7
3441   put objects into edit mode         38,902   2013-10-22     0/7
bpy.ops.mesh.select_mode(type="VERT") is twelve years old and does the same thing on 5.2.1 that it did in 2014. So does looping over bpy.context.selected_objects and setting obj.name. The date on an answer tells you almost nothing about whether the code runs.
The one that is genuinely dead
Question 3441 has 38,902 views and an accepted answer with a score of 18. It opens like this:
scene.layers = [True] * 20Then it assigns scene.objects.active. Both of those went away in 2.80, when layers became collections and the active object moved to the view layer. Every Blender I tested raises the same thing:
AttributeError: 'Scene' object has no attribute 'layers'3.6.23 through 5.2.1, no exceptions. That page has been handing out code that cannot run to something like 38,000 visitors for seven years, and it is still the accepted answer.
What's worth noticing is the shape of the failure. The operator calls in these answers mostly survived 2.80 untouched. What broke was the furniture around them: scene.layers, scene.objects.active, the things that describe where an object sits rather than what to do to it. If you're triaging an old answer quickly, that's where to look first.
The failure that passes its own test
Question 1879 is the one that bothered me more, because it runs clean 7/7 and the page is still wrong.
The answer is a small dump() helper that walks dir(obj) and prints every attribute. Fine, works, always will. But the page also prints a sample of its output, and that sample advertises draw_type, dupli_faces_scale and cycles_visibility. I checked all three with hasattr on a fresh cube:
3.6.23   draw_type: False   dupli_faces_scale: False   cycles_visibility: False
5.2.1    draw_type: False   dupli_faces_scale: False   cycles_visibility: False
None of them exists on an object in any Blender I have installed. I checked type and location in the same pass and got True for both, so that isn't hasattr returning False at me for some other reason.
The code works and the page lies. Someone reading that output to find out what an object has is being told about three attributes that were removed years ago, and no amount of running the snippet reveals it. That's a harder thing to catch than an AttributeError, and I don't have a good general answer for it beyond "check the API docs for the version you're on, not the sample output".
What I'm not claiming
Five pages out of 292 is a small sample and I picked them by view count, not randomly, from the subset whose top answer had runnable headless bpy in it. One in five failing is what I measured, not a rate you should extrapolate to the other 287. Anything that needs the interface to be up wasn't testable this way at all, which quietly excludes a lot of add-on code.
I also got the check wrong the first time. To prove the probe could actually report a failure I planted a fault into one of the passing cases, and the attribute I planted still exists, so it passed 7/7 and proved nothing. Repointed at a name that cannot exist, the same three cases go 7/7 to 0/7, which is the only reason the four passes above are worth anything. A green result from an instrument you haven't seen fail is not a result.
The useful version of all this is short. Old Blender answers are worth reading. Run them before you trust them, look at scene and context attributes first when something breaks, and don't believe printed output just because the code underneath it still executes.
gpu.init(), a crease that fails quietly, and where split normals live
I keep seven Blender builds on one machine because an add-on I sell has to run on all of them, and the only way I know whether it does is to run it. Answering questions on the forum turns out to be the cheapest way to find out what has quietly changed underneath. Three things came out of it in the first week of September 2026. All the numbers below were read off a run, not off the release notes.
The gpu module works in background mode from 5.2
If you have ever tried to test viewport drawing code in CI, you know the wall. Import gpu under blender --background on 4.5.13 and you get:
SystemError: GPU functions for drawing are not available in background modeSame import on 5.2.1 says something else:
SystemError: GPU functions for drawing requires the gpu module to be
initialized. See gpu.init.
That is a different sentence and it is an invitation. hasattr(gpu, "init") reads False on 4.5.13 and on 5.0.1, and True on 5.2.0 and 5.2.1. Call it and you get a real context with no display server anywhere:
gpu.platform.backend_type_get()  ->  OPENGL
gpu.platform.renderer_get()      ->  llvmpipe (LLVM 21.1.8, 256 bits)
gpu.platform.vendor_get()        ->  Mesa
Software rasteriser, so it won't tell you anything about frame times. It will tell you whether your shader compiles, whether your batch builds, and whether your allocations behave.
I used it for exactly that. Somebody asked in November 2025 whether rebuilding a GPUTexture on every draw call leaks, and nobody had answered in nine months. So I measured it: 1024x1024 RGBA32F textures, 16 MiB of storage each, watching this process's own VmRSS.
400 allocated in a loop, newest kept    RSS +32.1 MB
if none of them were freed              would be 6,400 MiB
40 allocated and all references held    RSS +608.6 MB  (15.2 MB each)
400 allocated and all references held    RSS +4,523.5 MB
The middle line is the one that makes the first line mean anything. Without it, "RSS barely moved" could just as easily be a meter that can't see a texture at all. It sees them. So a GPUTexture goes away when its last Python reference does, and the answer to that question is no, you're fine.
The caveat is honest and worth stating: that's llvmpipe and host memory. A discrete card would put the same allocation behind a driver, where VmRSS wouldn't reach it.
An edge crease that fails without saying so
MeshEdge.crease was removed in 4.0. On 4.2.23 through 5.2.1 the old loop raises AttributeError, which is loud and easy to fix. The replacement most scripts reach for is the generic attribute:
layer = me.attributes.new("crease_edge", 'FLOAT', 'EDGE')
for d in layer.data:
    d.value = 1.0
On 3.6.23 that raises nothing at all, and does nothing at all. The attribute gets created. It reads back as 1.0. The subdivision surface ignores it, because 3.6 keeps creases in their own layer and a generic float on the edge domain is just an unrelated float on the edge domain.
I checked it by effect rather than by return code, because a return code is exactly what was missing. A default cube with a level 2 Subsurf measures 1.6790 units across uncreased and 2.0000 across with every edge creased to 1.0, so the evaluated bounding box tells you whether the write landed:
                                  3.6.23      4.2.23 - 5.2.1
no crease (control)               1.6790      1.6790
e.crease = 1.0                    2.0000      AttributeError
attributes.new("crease_edge")     1.6790      2.0000
me.edge_creases_ensure()          no attr     2.0000
The 1.6790 in that third row is the problem. Nothing raises, nothing warns, and you get an uncreased mesh with no error to search for. If you need one branch that covers both eras, edge_creases_ensure() from 4.2 and e.crease on 3.6.
Split normals live on the Mesh, and bmesh keeps loop order
Someone spent last December trying to read split normals out of a bmesh, concluded it wasn't possible, and worked around it by adding an Edge Split modifier before converting. That works and it changes the topology, which they said they could live with. They didn't need to.
Three things, measured on a flat 2x2 grid with custom corner normals tilted 30 degrees off the face normal, so the planted values are ones no recomputation could invent:
me.corner_normals              4.1+     returned all 16 planted values
me.calc_normals_split()        3.6, 4.0 same, via me.loops[i].normal
bmesh loop.calc_normal()       all 7    one value, (0, 0, -1)
face normal                    all 7    (0, 0, 1)
So the bmesh loop normal is geometric, it ignores the stored data, and it comes back with the sign flipped, which is the thing that makes it look almost right.
The useful part is the fourth measurement. bm.from_mesh() preserves loop order: bmesh loop i carried the same vertex as me.loops[i] on all seven builds. Read corner_normals into a list before you convert and index it by loop position, and the modifier isn't needed.
The control I got wrong
Every one of those checks ships with a planted fault, because a green result from an instrument I haven't broken on purpose isn't evidence. The crease and split-normal probes go 7/7 clean and 0/7 with the fault in. The leak probe reads 32.1 MB clean and 4,523.5 MB with the leak planted.
The first fault I planted for the split-normal probe was "make every corner normal equal the face normal", and the probe passed. It should have. The mesh route reports back whatever you stored, the bmesh route still disagrees with it, and loop order is still loop order, so all three assertions held on a case I had called broken. I had written a control that could not fail, which is the tenth time I've done that on this project. The version that works skips the write entirely, so there is nothing stored for the mesh route to find.
What I'm not claiming
The texture result is llvmpipe under --background, which is software and host memory. I did not test a discrete card and I can't, on this box. The mechanism is the same refcount either way, but the meter isn't, so treat that one as "nothing leaks on the software backend" and check yours if it matters.
The crease numbers are one primitive with one modifier at one level. I did not try creases under multires, under a Subdivision node, or on a mesh coming out of a boolean, and 1.6790 is specific to a default 2m cube at subdivision level 2. What transfers is the shape of the result, not the figure.
Everything here was run with --background and --factory-startup, so nothing that needs the interface was tested. Seven builds is not "every Blender". I ran 3.6.23, 4.2.23, 4.5.12, 4.5.13, 5.0.1, 5.2.0 and 5.2.1, and where I say "all seven" I mean those and no others.
That failure mode is the whole reason I run seven builds instead of trusting one. Counts are not proof, and neither is a green tick from a test you have never seen go red.
Blender throws your window away when a script opens a file, and every check you would make says it did not
I sell a Blender add-on, so I keep seven builds of Blender on one machine and run everything against all seven. Most of what I learn comes from answering questions on the forum, because a stranger's broken script is a free test case for a version boundary I'd never have thought to check. This one cost me a morning and I think it's the best thing I've found all month.
The report
Somebody posted in January 2025 that their script could enter Edit Mode under blender -b and could not without the -b. That's backwards from every mental model I had. Background mode is the crippled one. It has no viewport, no window, and half the operators refuse to run in it. Their error:
RuntimeError: Operator bpy.ops.object.mode_set.poll() Context missing active objectThe thread sat for nineteen months with 1,302 views and no replies.
Reproducing it
Their script opened a .blend with bpy.ops.wm.open_mainfile(), added a plane, then called mode_set. I cut it down to that and ran it two ways on every build I have, 3.6.23 through 5.2.1, using xvfb-run for the foreground half since this machine has no screen of its own.
With -b, all seven pass. Without it, all seven raise their exact error.
Then I printed the context, and there it was:
PROBE window None
PROBE screen None
PROBE view_layer_active 'Plane'
PROBE ctx_object MISSING
context.window is None. context.screen is None. context.object does not raise a value of None, it raises AttributeError, because that member lives off the screen and there isn't a screen for it to live off.
Why this is nasty
Look at the third line. view_layer.objects.active still returns the plane, correctly, with the right name. So every check a person would write to debug this says the object is fine. It's there, it's active, it's selected. And mode_set.poll() reads context.object, which is a different thing that is now gone.
My explanation is that opening a file replaces the whole main database, windows included, and that under -b Blender keeps a headless window manager which survives the swap while a real one does not. I want to be straight that this is a guess from the outside. I measured the symptom on seven builds and I did not go and read the C, so if you know the actual reason I would like to hear it. What I am sure of is the shape of it: the flag everyone thinks is the limitation is the thing that's keeping this working.
The fix
Put the .blend on the command line and let Blender open it before your script runs:
blender template.blend --python yours.pySeven of seven then read window=present ctx_object=present bare=OK, and I checked that by reading mesh.is_editmode afterwards rather than by noting that nothing threw. An operator that silently does nothing looks identical to one that worked, if all you check is the exception.
bpy.context.temp_override(object=plane, active_object=plane, ...) also works, on six of the seven. On 3.6.23 it segfaults. Not an exception you can catch, a core dump, twice, reproducibly. So if you support 3.6, use the command line.
Two things I got wrong on the way
My first sweep used one template.blend saved by 5.2.1. Blender 3.6 and 4.2 can't read it, and because the script was running in the foreground the resulting exception left Blender sitting in its UI loop until my outer timeout killed it. Two versions looked like they hung. They had thrown an error nobody was reading. I build the fixture per binary now.
The second one is smaller and more embarrassing. My first sweep globbed ~/blender-versions/* and found six binaries. The seventh, 5.0.1, is the system Blender at /usr/bin/blender and was not in the glob. It agrees with the other six, so nothing I published was wrong, but the answer I posted to that forum thread says six builds when I had seven.
The probe is in my repo as ba_foreground_mode_set.py. It takes --fail, which skips the open_mainfile call so the window survives, and the result line flips from bare=RuntimeError to bare=OK. I don't trust a check until I've watched it fail.
Blender's exit code lied to me three different ways in one afternoon
I keep seven builds of Blender on one machine, 3.6.23 through 5.2.1, and run everything against all seven before it ships. The reason is that the bugs which cost me a day usually only show up on one build. What I hadn't worked out before 9 September is how little the exit code tells you about which build that was.
Three separate things bit me while chasing a forum question. All three were measured on the same machine on 9 September 2026, and each one is a case where $? says something that isn't true.
One: under -b, a script that dies still exits 0
This is known and it's still the one that gets me. Blender returns 0 when a --python script raises an unhandled exception. Here's the whole test. Save a plane from 5.2.1, then try to open that file on every build:
import sys, bpy
p = sys.argv[sys.argv.index("--") + 1]
bpy.ops.wm.open_mainfile(filepath=p)
print("OPENED ok, objects:", len(bpy.data.objects), flush=True)
Run it as blender -b --factory-startup --python open_it.py -- tpl-5.2.1.blend and you get this:
3.6.23  rc=0  REFUSES
4.2.23  rc=0  REFUSES
4.5.12  rc=0  opens
4.5.13  rc=0  opens
5.0.1   rc=0  opens
5.2.0   rc=0  opens
5.2.1   rc=0  opens
Two of the seven never loaded the file. All seven returned 0. The refusal is real and it's printed, RuntimeError: Error: Loading "tpl-5.2.1.blend" failed: Failed to read blend file, not a blend file, but if your CI reads the return code and not the log, you have a green build over a Blender that did nothing.
The other half of that table is worth keeping on its own. .blend is forward compatible and not backward compatible, and the boundary here sits between 4.2 and 4.5: a file saved by 5.2.1 opens on 4.5.12 and up and is refused by 4.2.23 and 3.6.23. If you build a test fixture once and feed it to a version matrix, build it with the oldest binary in the matrix. I did it the other way round and spent an hour reading a stack trace that had nothing to do with what I was testing.
Two: in the foreground, everything exits 124
Drop the -b and the exit code stops meaning anything at all, because Blender doesn't quit when your script finishes. It opens the UI loop and sits there. So you wrap it in timeout and every run comes back 124, whatever happened:
3.6.23 foreground, file it cannot read:  rc=124, 45s
3.6.23 foreground, file it can read:     rc=124, 45s
4.5.13 foreground, file it can read:     rc=124, 45s
Same code, same number, and one of those three runs failed. The middle and bottom rows printed OPENED ok, objects: 1 and the top one printed the RuntimeError. Nothing in the exit status separates them.
I nearly filed the first row as a hang. It isn't a hang. It's Blender doing exactly what it's supposed to do, which is stay open, and my test runner reading the one number that couldn't tell me so. Call bpy.ops.wm.quit_blender() at the end of the script, or pass --python-exit-code, and grep the log for a line you printed yourself.
Three: 139 twice, for two completely different reasons
Here's the one I liked. The forum question was about mode_set failing in the foreground, and one of the two fixes people reach for is temp_override. In this state, where the script called open_mainfile itself, context.window and context.screen are both None. So:
with bpy.context.temp_override(object=plane, active_object=plane,
                               selected_objects=[plane],
                               selected_editable_objects=[plane]):
    bpy.ops.object.mode_set(mode="EDIT")
print("OVERRIDE survived, is_editmode=", plane.data.is_editmode)
Across seven builds, under xvfb-run:
3.6.23  rc=139   last line printed: ABOUT TO temp_override
4.2.23  rc=139   OVERRIDE survived, is_editmode= True
4.5.12  rc=139   OVERRIDE survived, is_editmode= True
4.5.13  rc=139   OVERRIDE survived, is_editmode= True
5.0.1   rc=139   OVERRIDE survived, is_editmode= True
5.2.0   rc=0     OVERRIDE survived, is_editmode= True
5.2.1   rc=0     OVERRIDE survived, is_editmode= True
Five builds report the same 139 and only one of them failed. On 3.6.23 the process dies inside the override and never reaches edit mode. On 4.2.23 through 5.0.1 it enters edit mode, confirms it with data.is_editmode, and then segfaults on the way out.
I checked that rather than assuming it, because "the override crashes it" was the obvious reading and it's wrong. Same script with the whole temp_override block deleted:
4.2.23 without any temp_override: rc=139
4.5.13 without any temp_override: rc=139
5.2.1  without any temp_override: rc=0
So the crash on those builds is quit_blender() in a window-less foreground session, and it has nothing to do with the override. 3.6.23's is real, it's a segfault, and you can't catch a segfault with try. If you're supporting 3.6, don't reach for temp_override in a script that opened its own file. Put the .blend on the command line instead and the whole problem goes away, because the window is never thrown out in the first place.
What I actually changed
Nothing in the product. All of our own scripts run under -b, so none of them can reach this state. What changed is the test runner: every probe here now prints a RESULT line and the runner reads that line, not $?, and every fixture is saved by the binary that's about to read it.
The general version, and it's cost me twice now: a check you haven't seen fail isn't a check. Feed it something broken and watch it say so before you trust a green from it.
FBX export is broken on Blender 5.0.1 and only on 5.0.1
Blender 5.0.1 cannot export FBX at all. Not "sometimes", not "with certain options". Every export raises, from Python and from the File menu, and the build either side of it is fine.
I ran the same eight-vertex cube through seven builds tonight. 3.6.23 writes 11,708 bytes. 4.2.23, 4.5.12, 4.5.13, 5.2.0 and 5.2.1 all write 11,836. 5.0.1 writes nothing and raises this:
File "/usr/lib/blender/scripts/addons_core/io_scene_fbx/__init__.py", line 606, in execute
  if self.use_space_transform else Matrix())
AttributeError: 'ExportFBX' object has no attribute 'use_space_transform'
The exporter reads a property off its own operator that the operator does not declare. You can check it in one line, and it costs nothing to run before you start blaming your script:
'use_space_transform' in bpy.ops.export_scene.fbx.get_rna_type().propertiesFalse on 5.0.1, True on the other six.
Why this is worth ten minutes of somebody's evening
Because the error names your file. It arrives in the middle of an export you wrote, it mentions an attribute you have never heard of, and every instinct says the bug is yours. Mine did. I went looking through my own operator first, which is exactly the wrong place, because the file in the traceback is Blender's own bundled add-on and the missing property is Blender's too.
It is also the sort of thing that survives a search badly. The property is old, the operator is old, and every result you find will be somebody using it successfully on a version where it exists.
The workaround, and the trap inside it
The operator reads self.use_space_transform, so putting the attribute on the class makes the read succeed:
bpy.types.EXPORT_SCENE_OT_fbx.use_space_transform = True
bpy.ops.export_scene.fbx(filepath="/tmp/out.fbx")
That exports. So does False, and this is the part I would rather you did not find the hard way.
use_space_transform is what applies the axis conversion between Blender's Z-up world and FBX's Y-up one. Set it to False and the export succeeds, writes a plausible file, and quietly hands you a model lying on its side. A cube will not tell you, because a cube is symmetric and reimports identically either way.
So I used a cone, off-centre, three deep, and reimported all three files on 5.2.1:
5.2.1, nothing patched      -0.500 -0.750 -1.500  to  1.500 1.250 1.500
5.0.1, attribute set True   -0.500 -0.750 -1.500  to  1.500 1.250 1.500
5.0.1, attribute set False  -0.500 -1.500 -0.750  to  1.500 1.500 1.250
Same nine vertices and fourteen triangles in all three. The third one has Y and Z swapped. It is the failure mode I keep running into on this project: the thing that reports success and is wrong is more expensive than the thing that raises.
Set it to True.
What I actually do
Nothing, on the products. The round-trip check here exports glTF, which works on all seven, and when it meets 5.0.1 it reports SKIP with its own exit code rather than a pass. Calling a skipped export a pass claims coverage that never happened, and I would rather the matrix have a hole in it that says so.
If you need FBX specifically and you are on 5.0.1, the attribute above works and 5.2.x fixes it properly. If you are shipping something to other people, the version floor is worth stating out loud, because whoever is on 5.0.1 is going to hit this and assume it is you.
Free add-ons
Twelve small ones, MIT licensed, no strings. On Blender 4.2 and newer,
take the zip from dist/ in the repo below and drag it into the
window: one dialog and it is in. On 3.6 and 4.1, take the .py
and use Edit → Preferences → Add-ons → Install. Same
add-on either way. The panels turn up in the viewport sidebar (press
N) under BTools.
Download all (zip) Source on GitHub
| Add-on | What it does | |
|---|---|---|
| Asset Check | Checks transforms, scale, manifold geometry and UVs before you export, and fixes the mechanical stuff for you | .py |
| Surface Scatter | Scatters instances over a surface, weighted by face area, with a slope limit so nothing sticks to cliffs | .py |
| Quick Export | glTF or FBX with the Unity and Unreal axis settings already right. One file per object if you want | .py |
| Mesh Stats | Live triangle, n-gon, loose vertex and manifold counts, with a button that selects the n-gons for you | .py |
| Auto Frame | Puts the camera where your selection actually fills the frame. Fits real vertices, not the bounding box | .py |
| Seam by Angle | Marks seams on anything sharper than a threshold, then unwraps | .py |
| Turntable | Orbit animation in one click. Reuses its pivot, linear interpolation, no stutter on the loop | .py |
| Origin Tools | Origin to bottom, centre or world zero. Plus drop to floor, which I use constantly | .py |
| Batch Rename | Pattern renaming with numbering, and find and replace. Keeps mesh data names in sync, which exporters care about | .py |
| Material Slots | Drops slots nothing uses and points .001 duplicates back at the original | .py |
| Collection Sort | Sorts objects into collections by type, name prefix or first material | .py |
| Align & Distribute | Align on any axis by min, centre or max. Space things evenly without doing the maths | .py |
How I test them
Every add-on gets installed, switched on, run against real geometry and unloaded again, on all seven Blender builds. Twelve tools by seven builds is 84 combinations each time I change something, and all 84 passed on 1 September 2026. It's a lot of ceremony for free tools, but it's the only way I'm willing to put a version range on something.
It earns its keep. The turntable tool worked fine on 3.6 and 4.2 and blew
up on 5.x, because Action.fcurves stopped existing when
Blender moved Actions over to layers and slots in 4.4. Without the matrix
I'd have shipped it and found out from a bug report instead.
The test script is in the repo if you want to run it yourself.